Ethereum has been one of the best-performing assets in 2020, bar none. It beat Bitcoin, gold, stocks, and other assets in the best return on investment, had the $1,200 stimulus check be entirely invested in assets.
But after today’s 10% intraday drop, the top-ranked altcoin is at risk of closing the daily with a bearish engulfing candle. If the bearish candlestick formation confirms, a short-term downtrend may follow.
Ethereum Crashes 10% Intraday, Risk Of Bearish Engulfing If Daily Closes Below $390
Ethereum’s nearly 250% year-to-date rally may be finally ending, as the cryptocurrency plunged 10% today as part of a greater cryptocurrency market selloff. The crypto market is a sea of red, after Bitcoin, Ethereum, XRP, and most top altcoins took a tumble.
Because Ethereum rose among the most during the way up, it has fallen some of the hardest as well.
Related Reading | Time To Pay Attention: Indicator Hints At 50% Or More Correction In Ethereum
On daily timeframes, the drop against the dollar has resulted in a bearish engulfing candle possibly forming. A close below $390 would confirm the bearish reversal pattern.
ETHUSD Daily Bearish Engulfing | Source: TradingView
Japanese candlesticks, either by themselves or as part of a sequence, can provide traders with powerful signals. A bearish engulfing pattern occurs when a red candle close completely envelopes the previous green candle, and then some.
A bearish engulfing candle shows that bears have taken control of Ethereum. However, as severe as daily timeframes may appear, on ETHUSD weekly timeframes, this drop could be a retest of former resistance turned support. If so, things are a lot more bullish than they appear at a glance.
ETHUSD Falls To Weekly Support, Holding Is Critical For Uptrend Continuation
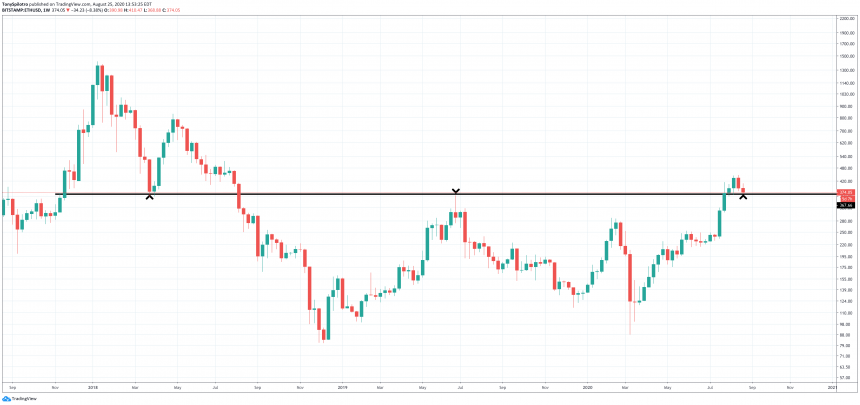
Although the top-ranked altcoin suffered as staggering drop today, the fall landed nearly perfectly at weekly resistance turned support. Often when assets breakthrough important resistance levels, a retest to confirm the support and resistance flip takes place.
Related Reading | Analyst: The “Real” Altcoin Party Begins In Early 2021
Once the support is proven valid, the corresponding price action gives investors and traders confidence to start buying again, pushing prices higher.
ETHUSD Weekly Support and Resistance Flip | Source: TradingView
The support acted as such after Ethereum topped out in early 2018. The first major fall, took Ethereum to roughly $370. This is also the level where Ethereum peaked in 2019, before falling back down to the Black Thursday low.
The asset is back up over 326% from that low, so the current selloff could be normal profit-taking before the next major advance. Still, the 10% intraday selloff and possible bearish engulfing candle on the daily could provide the momentum to cause Ethereum to lose this critical support.
The next major support below is the February 2020 top at roughly $285 per ETH token, If Ethereum cannot hold there, a revisit deeper to roughly $225 is possible. If that can’t hold, the crypto market may be in for another bear trend.


