

Ethereum price started a downside correction from the key $180 resistance area against the US Dollar. ETH is currently below $175, but it is holding the 100 hourly simple moving average.
- Ethereum failed to climb above $180 once again and recently declined below $175 against the US Dollar.
- The price is now trading near the $170 support and the 100 hourly simple moving average.
- Yesterday’s highlighted key major ascending channel was breached with support near $175 on the hourly chart of ETH/USD (data feed via Kraken).
- Bitcoin price also corrected lower after it failed to continue above the $9,500 resistance.
Ethereum Price Starts Corrective Decrease
Yesterday, we discussed the last line of defense for Ethereum bears near the $180 area against the US Dollar. ETH price did struggle to continue above the $178 and $180 resistance levels.
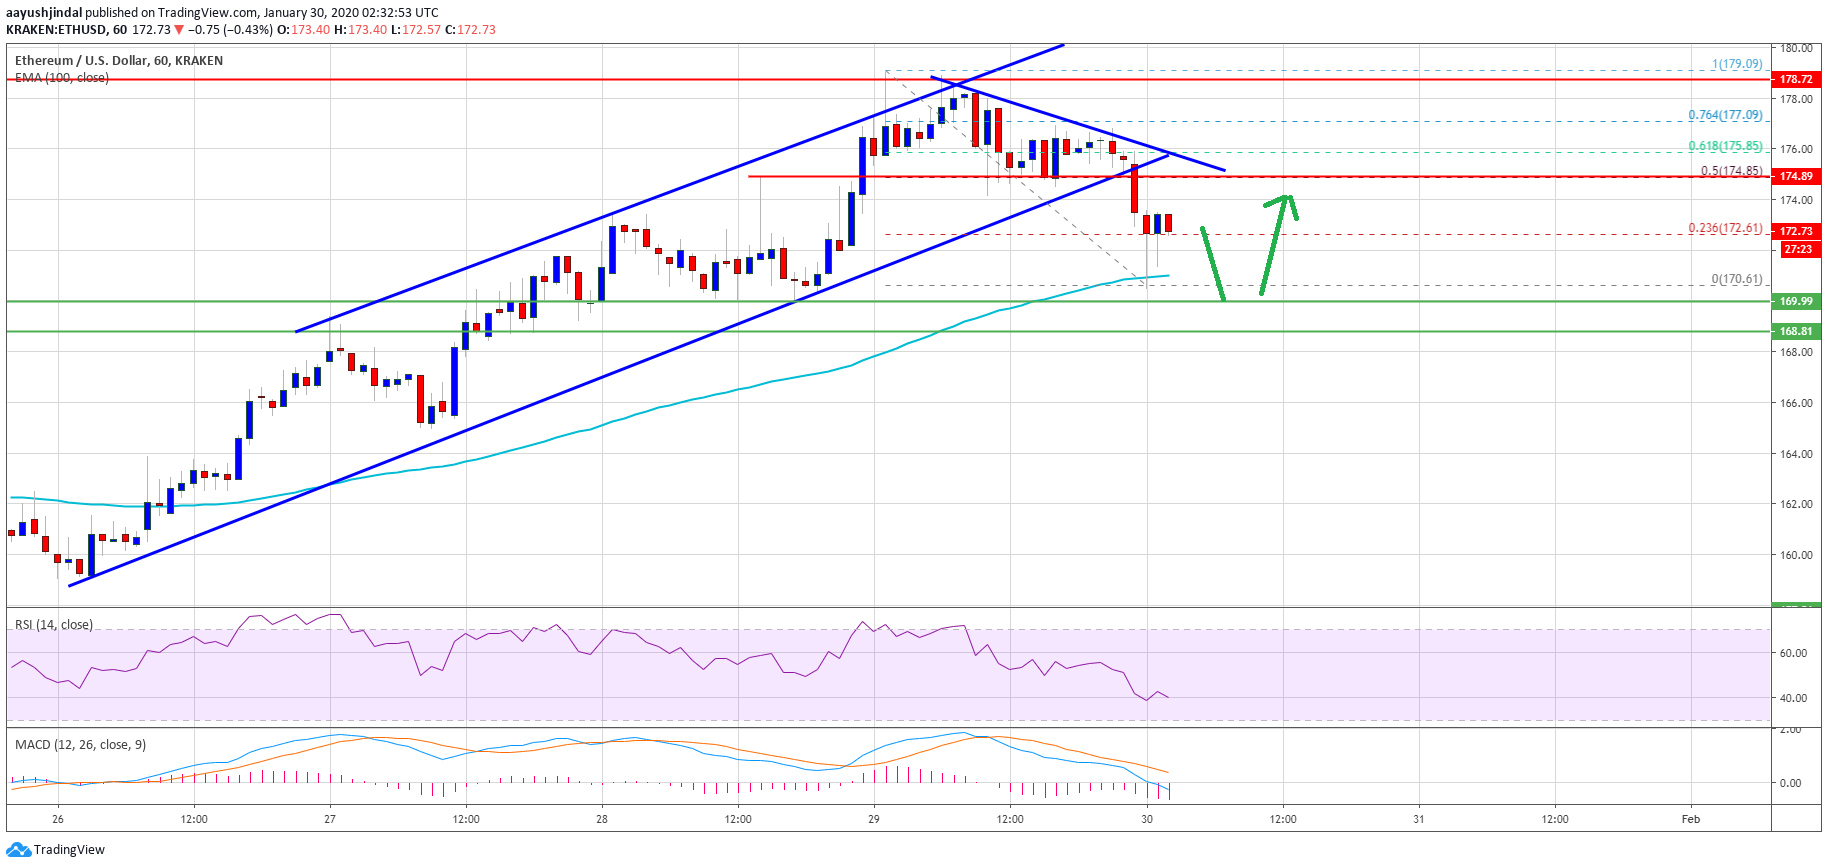
As a result, there was a bearish reaction below the $175 support area. More importantly, yesterday’s highlighted key major ascending channel was breached with support near $175 on the hourly chart of ETH/USD.
It opened the doors for more losses below the $174 and $172 levels. Finally, Ethereum tested the $170 support area and found bids near the 100 hourly simple moving average.
A swing low is formed near $170 and the price is currently testing the 23.6% Fib retracement level of the recent slide from the $179 swing high to $170 low. However, there are many hurdles on the upside near the $175 level.
The previous support near $175 is now near the 50% Fib retracement level of the recent slide from the $179 swing high to $170 low. Besides, there is a connecting bearish trend line forming on the same chart with resistance near the $175 level.
Therefore, a successful close above the $175 area is needed for a fresh rally in Ethereum. In the mentioned case, the price is likely to retest the main $178 and $180 resistance levels.
ETH Downside Break Possibility
As seen in the chart, the $170 support seems important. If the bulls fail to keep Ethereum above the $170 support, there is a risk of a larger decline.
A successful close below $170 and the 100 hourly simple moving average could lead the price towards the $168 support in the short term. The next major support is near the $164 level.
Technical Indicators
Hourly MACD – The MACD for ETH/USD is gaining momentum in the bearish zone.
Hourly RSI – The RSI for ETH/USD is now below the 50 level, with a bearish angle.
Major Support Level – $170
Major Resistance Level – $175


