

Ethereum is struggling to gain bullish momentum above the $142 and $144 resistances against the US Dollar. ETH price could start a major decline if it breaks the $135 support.
- Ethereum is facing an uphill task as the bulls struggle near $135 against the US Dollar.
- The price is currently holding the $135 support and the 100 hourly simple moving average.
- There is a major bullish trend line forming with support near $135 on the hourly chart of ETH/USD (data feed via Kraken).
- Bitcoin price is slowly gaining pace, but it must break the $6,700 and $6,800 resistance levels.
Ethereum Price Holding Key Support
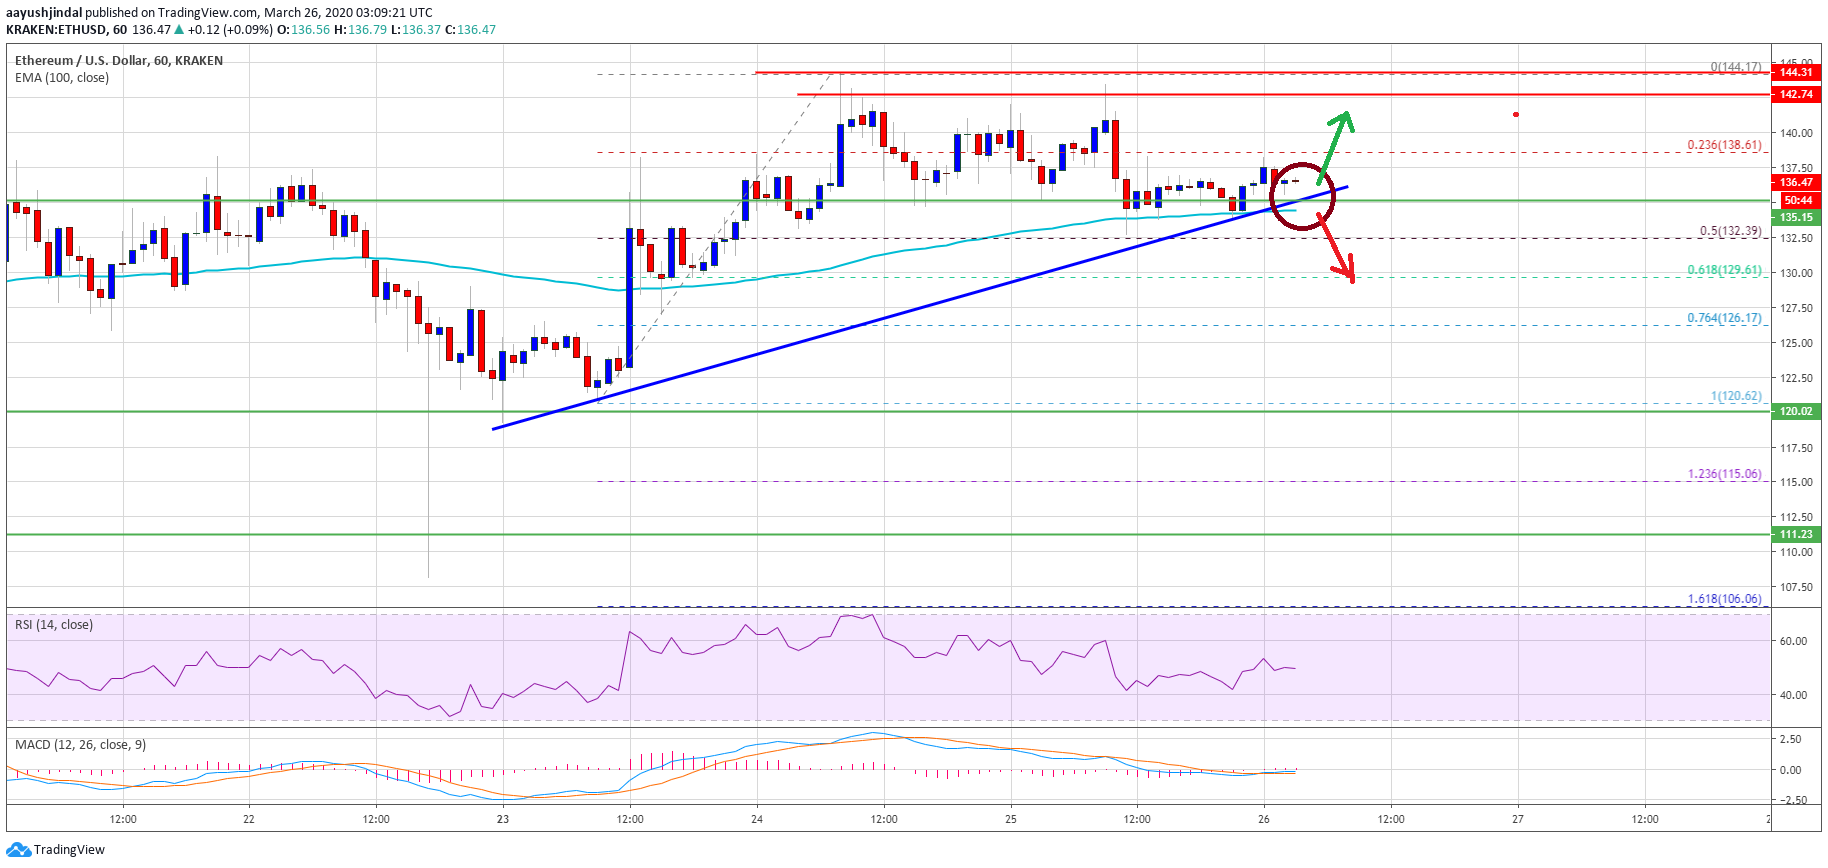
In the past three sessions, Ethereum made a couple of attempts to surpass the $142 and $144 resistance levels against the US Dollar. However, ETH price failed to continue above $144 and started a downside correction.
There was a break below the $140 level, plus the 23.6% Fib retracement level of the upward move from the $120 swing low to $144 high. The price even spiked below the $135 support, but the 100 hourly simple moving average acted as a strong support.
The 50% Fib retracement level of the upward move from the $120 swing low to $144 high is also acting as a decent support for the bulls. Besides, there is a major bullish trend line forming with support near $135 on the hourly chart of ETH/USD.
Ethereum is clearly trading near a key support at $135 and the 100 hourly SMA. If the bulls fail to defend the $135 support level and the 100 hourly SMA, there is a risk of a sharp decline towards the $130 and $128 levels.
The main support below $130 is near the $120 level, where the bulls are likely to take a stand in the near term.
Chances of a Bullish Break
On the upside, the main hurdles for Ethereum are near the $142 and $144 levels. If the bulls succeed in clearing the $144 resistance, the price is likely to surge above the $145 and $148 levels.
The next resistance is near the $150 level, above which the bulls are likely to aim a test of the $158 level in the coming sessions. Any further gains could lead the price towards $165.
Technical Indicators
Hourly MACD – The MACD for ETH/USD is slowly gaining momentum in the bearish zone.
Hourly RSI – The RSI for ETH/USD is currently struggling to stay above the 50 level.
Major Support Level – $135
Major Resistance Level – $144


