

- Ethereum price is showing positive signs above the $175 and $180 levels against the US Dollar.
- Bitcoin price is climbing higher and it is likely to revisit the key $10,000 resistance area.
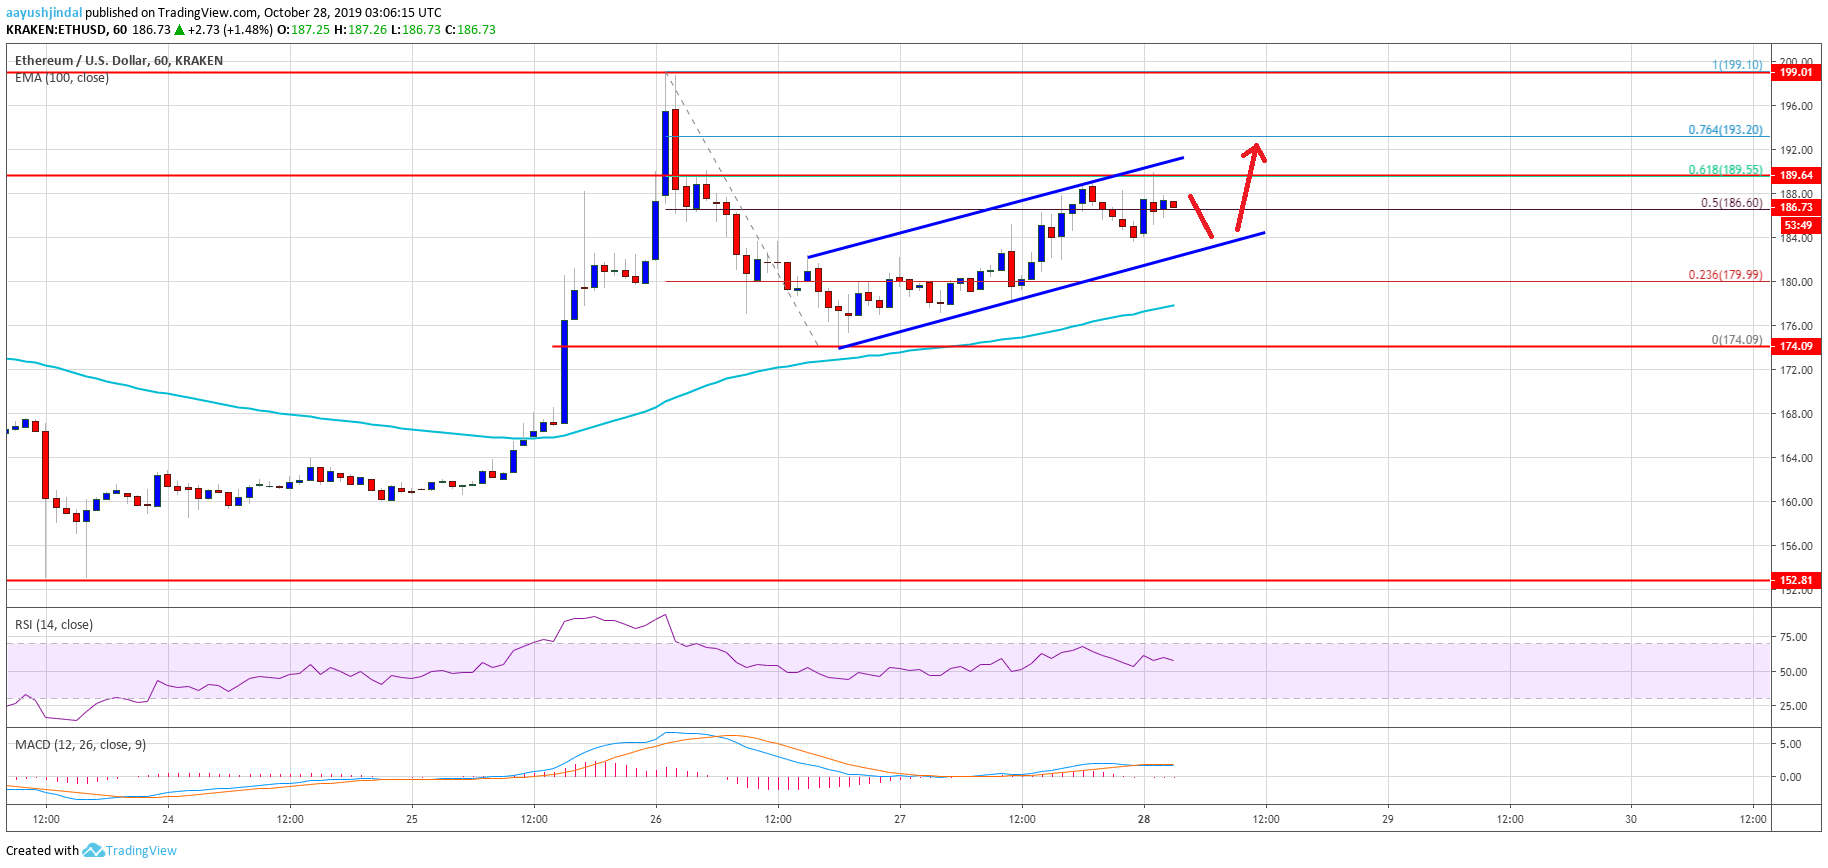
- There is a rising channel forming with support near $183 on the hourly chart of ETH/USD (data feed via Kraken).
- The pair is likely to continue higher and it break the $190 and $192 resistance levels in the near term.
Ethereum price is grinding higher with positive signs versus the US Dollar, while bitcoin is approaching $10,000. ETH price must break $190 to climb towards $200.
Ethereum Price Analysis
In the past few days, there was a sharp rally in Ethereum above the $175 and $180 resistance levels. Later, there was a downside correction, but the price remained well bid above $175 and the 100 hourly simple moving average.
Similarly, bitcoin price rallied above the $10,000 level and recently corrected lower. However, BTC also found support and it is climbing higher again towards the main $10,000 resistance area.
The recent swing low was near $175 before Ethereum started a fresh increase. It broke the $180 and $182 resistance levels. Moreover, there was a break above the 50% Fib retracement level of the downward move from the $199 high to $175 swing low.
The price tested the $190 resistance level, where the bears are putting up a strong fight. Additionally, it seems like the 61.8% Fib retracement level of the downward move from the $199 high to $175 swing low is acting as a resistance.
Therefore, an upside break above the $190 resistance is likely to open the doors for more gains in the coming sessions. The next major resistance is near the $198 and $200 levels. An intermediate resistance is $194 or the 76.4% Fib retracement level of the downward move from the $199 high to $175 swing low.
On the downside, there are many supports near the $180 level. Besides, there is a rising channel forming with support near $183 on the hourly chart of ETH/USD. If there is a downside break, the price could test the 100 hourly SMA or the $175 support.
Looking at the chart, Ethereum price is clearly climbing higher steadily above $185. Having said that, the price must break the $190 resistance level to continue higher. If not, there are chances of another downside correction towards the $175 support area in the near term.
ETH Technical Indicators
Hourly MACD – The MACD for ETH/USD is slowly losing momentum in the bullish zone.
Hourly RSI – The RSI for ETH/USD is correcting lower and it is approaching the 50 level.
Major Support Level – $180
Major Resistance Level – $190


