On-chain data shows despite the Bitcoin drop to $47k, Coinbase saw outflows of around 31k BTC, a sign that the market could still be bullish.
Outflows Of 31k BTC On Crypto Exchange Coinbase
As pointed out by a CryptoQuant post, the popular crypto exchange Coinbase has observed huge Bitcoin outflows today.
As is apparent from the name, the “outflows” indicator shows the amount of BTC transferred from an exchange to personal wallets.
A huge spike in the metric’s value means big investors are moving their Bitcoin out of exchanges either to hodl or for selling through OTC deals.
Therefore, outflows are generally good signs for the cryptocurrency’s price as they may imply that there is a buying pressure in the market.
Now, here is the chart for Coinbase Pro Bitcoin outflows over the past few months:
Coinbase Pro outflows show a huge spike | Source: CryptoQuant
As the above graph displays, the indicator has shot up for Coinbase Pro. The outflow value was about 31,107 BTC, which is worth over $1.5 billion at the current price exchange.
The exchange is mainly used by US institutional investors so that such a large spike could be bullish for the cryptocurrency.
Related Reading | 4 Reasons Why Bitcoin Remains Bullish, What Might Bring New ATHs
Big outflows are generally associated with an increase in the price shortly after. A look at the Coinbase Pro outflow history supports the trend; from March 2020 onwards, similar values of the indicator became frequent as the bull run marched on.
Bitcoin Price
At the time of writing, BTC’s price floats around $48.5k, down 0.16% in the last 24 hours. Though, over the last week the cryptocurrency is still green as its value is about 6.8% up.
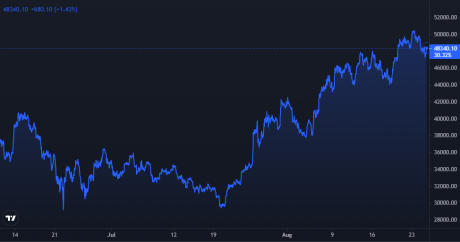
In the past 30 days, Bitcoin has accumulated 26.4% in gains. The below chart showcases the trends in the price of the coin over the last three months:
BTC's price sharply falls down after touching the $50k price level | Source: BTCUSD on TradingView
After weeks of climbing upwards, BTC was finally able to break $50k a couple of days ago for the first time since May. However, the coin couldn’t sustain at the level and was rejected downwards.
Related Reading | Will Ethereum Reach Its All-Time-High Before Bitcoin?
The downtrend has been sharp, and earlier today the price fell down to as low as $47k. However, since then it has recovered somewhat to above the $48k level.
It’s unclear which direction Bitcoin will go in next, but if the Coinbase Pro outflows are anything to go by, signs seem to be still bullish for the market. Though, at the moment BTC’s on-chain activity is still very low. If the coin tests $50k again without the network activity going up, a bearish signal could flare up instead.


