During an interview with Bloomberg TV on May 3, Binance CEO Changpeng Zhao suggested that Bitcoin (BTC) “is probably less volatile” than the stock prices of Apple (AAPL) and Tesla (TSLA).
Zhao argued that crypto’s volatility was not unlike the stock market, adding: that “volatility is everywhere” and that “it is not unique to crypto.”
However, those involved in cryptocurrency trading probably know that cryptocurrency prices fluctuate a lot more than listed trillion-dollar companies. This begs one to question whether or not Zhao is detecting a trend that some may have missed?
The first obvious reading from the chart above is that both Bitcoin and Tesla share different volatility levels when compared to trillion-dollar stocks like Apple and Amazon.
Moreover, stocks seem to have experienced a 60-day volatility peak in November 2020, while Bitcoin was relatively calm.
Tesla is an exception rather than the norm
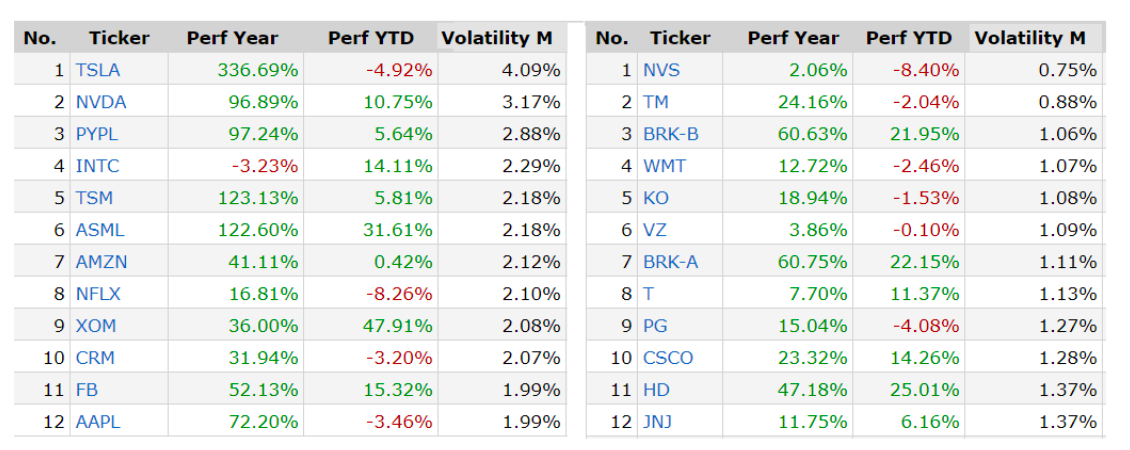
Another thing to consider is that Tesla’s market capitalization is $633 billion, and it has yet to post a quarterly net income above $500 million. Meanwhile, every single top-20 global company is incredibly profitable. These include Microsoft (MSFT), Google (GOOG), Facebook (FB), Saudi Aramco (ARAMCO.AB), Alibaba (BABA), and TSM Semiconductor (TSM).

The list above shows the top-12 and bottom-12 most volatile stocks to show how Tesla’s (TSLA) price swings are far off the average of other $200 billion market cap companies. The volatility seen in cryptocurrencies has been the norm, given that there is a lack of earnings, a very early adoption-stage cycle, and a lack of an established valuation model.
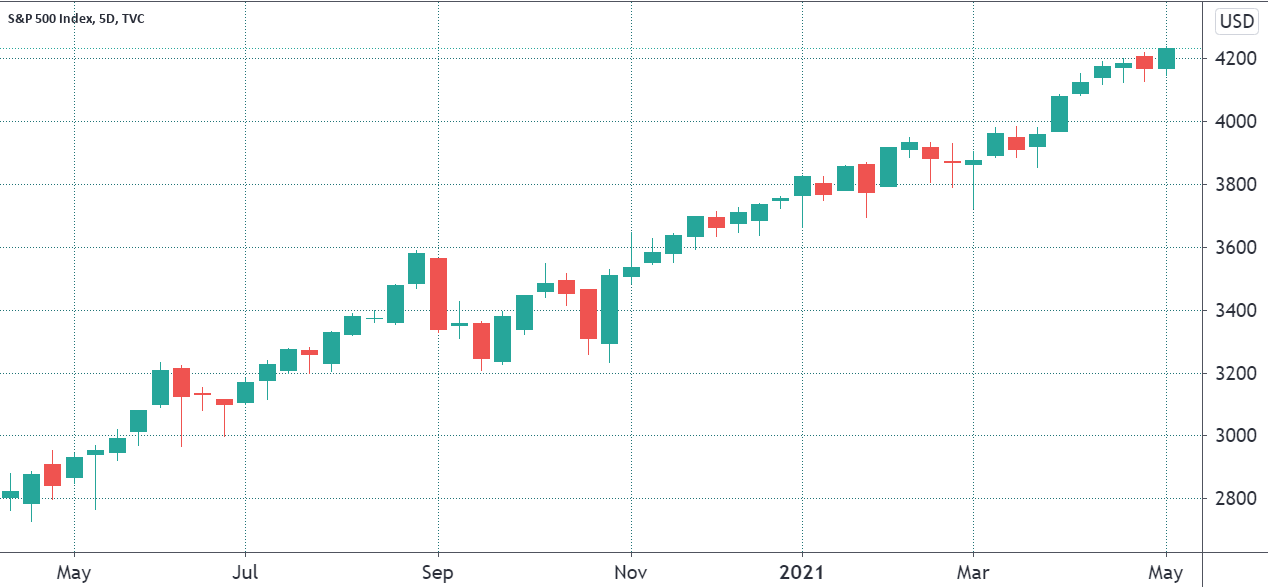
One doesn’t need to be an expert in statistics to ascertain that the S&P 500 index performance has been pretty much stable over the past year, apart from a couple of weeks back in September and October 2020.

Zhao may be the founder of the leading crypto exchange, but he doesn’t personally trade. On the contrary, he actually recommends holding (HODL) instead of trading in every instance possible.
Lol, I don’t do leverage or loans. I don’t even trade. I just hodl #bnb.
— CZ Binance (@cz_binance) January 12, 2021
If you feel stressed out during every dip, you probably should not trade much, or at least change your trading strategy. Maybe just #HODL?
Not the best advice for our business (trading fees), but probably good advice for many new “traders”.
Not financial advice.
— CZ Binance (@cz_binance) April 22, 2021
Volatility does not measure returns
Exclusively analyzing volatility presents another big problem. The indicator leaves out the most important metric for investors, the return. Whether an asset is more or less volatile doesn’t matter if, on average, one asset consistently posts higher gains than others.
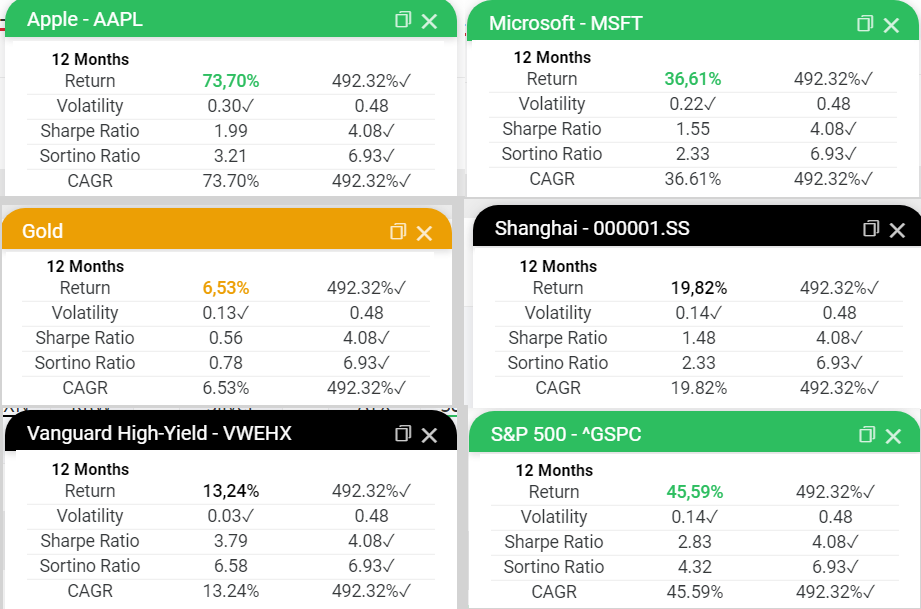
MicroStrategy has listed almost every currency, stock index, and S&P 500 index component, and curious analysts can compare returns and the sharpe ratio side-by-side with Bitcoin’s.
As explained in the footnotes:
“The Sharpe ratio is a measure of risk-adjusted (really volatility-adjusted) returns. It is a way to measure how much return an investment generated for the risk (volatility) endured over some time horizon.”

As the data clearly states, Bitcoin is the winner on risk-return metrics against every major asset and index over the past 12 months. A similar outcome also takes place when using a 5-year timeframe.
Therefore, Zhao may have simply incorrectly stated that Bitcoin’s volatility is similar to the stock of trillion-dollar companies. However, when adjusting the metric based on returns, it is the incontestable winner.
The views and opinions expressed here are solely those of the author and do not necessarily reflect the views of Cryptox. Every investment and trading move involves risk. You should conduct your own research when making a decision.


