This week Bitcoin price pulled off an incredible rally that appears to have exceeded the expectations of many investors. Data from Cryptox Markets and CoinMarketCap shows record trading volume across multiple crypto exchanges occurred as Bitcoin rallied to $9,400 but this doesn’t mean that the long awaited bull market has started.
Crypto market daily price chart. Source: Coin360
History shows that whenever the Bitcoin (BTC) price increased by more than $1,000 on a single day, it was susceptible to a major correction. The recent surge from $7,700 to $9,400 and the pattern of corrections identified by analysts suggests a pullback is likely.
Several technical indicators indicate the possibility of a short-term correction. Most notably, the relative strength index (RSI) on the daily chart is at 72, suggesting Bitcoin has become overbought.
Strong arguments for a severe Bitcoin drop
The Bitcoin price surged past three major trend reversal points as it hit $9,400. It surpassed the 200-day simple moving average (SMA), the 200-day exponential moving average (EMA), and the 0.618 Fibonacci Retracement level calculated in between $3,600 and $14,000.
Typically, Bitcoin does not surpass all three key resistance areas in an intraday move without any sign of a pullback. When it does, it leaves the asset vulnerable to a steep drop as traders look to take profit on their positions.
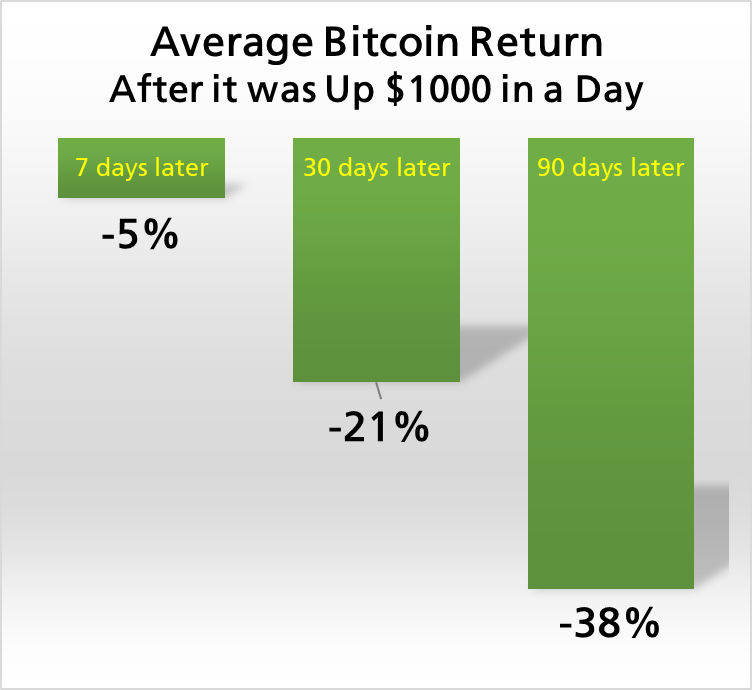
Timothy Peterson, CAIA Manager at Cane Island Alternative Advisors, said that Bitcoin price gained more than $1,000 within a 24-hour span only 14 times in its history.
According to Peterson, after intraday $1,000 moves, Bitcoin price fell by 5 percent, 21 percent, and 38 percent respectively.
Bitcoin returns after $1,000 intraday moves. Source: Timothy Peterson
The price tends to see major drops after a 10 to 20 percent move because it shifts the market structure in a short period of time. The market often goes from a majority short to majority long, raising the probability of a large long squeeze.
On BitMEX, for instance, the funding rate of Ether (ETH) futures is over 0.11 percent. This means, when a trader opens a $100,000 long position, the trader would have to pay $110 every eight hours, or $330 every day to keep the position open.
When the price of cryptocurrencies begin to fall and lose momentum, the expensive funding rates pressure long holders to adjust their positions, causing a market drop.
Variables to watch out for
The Bitcoin market can remain irrational for extended periods of time. Funding rates can be significantly high and the market can be overbought for days or even weeks before a correction ensues.
Currently, the overall sentiment around high-risk assets is improving based on hopes of reopening economies in the U.S. and Europe. As a result major markets and crypto prices are moving higher.
Bitcoin is likely benefiting from growing positivity in the global equities market, causing it to see an overextended upsurge in a short time frame. Even though Bitcoin appears to have changed its trend from bearish to bullish, any downturn in traditional markets or negative news related to the coronavirus pandemic could easily lead the crypto market to give up its recent gains.


