

The cryptocurrency market is trying to recover. And if such assets as Bitcoin and Ethereum are looking quite confident in favor of further growth, the other ones, like Litecoin and EOS are very likely to fall and test their respective support areas.
Dmitriy Gurkovskiy, a senior analyst at foreign exchange broker RoboForex, provides his vision of the possible tendencies in price changes for Bitcoin as well as for other major cryptos.
After the cryptocurrencies complete these movements, signals for further growth may appear and they may try to form new ascending structures. The leading asset here is Ethereum: we can see a large Double Bottom reversal pattern in the daily chart of the cryptocurrency, which indicates a potential ascending movement towards $600. In addition to that, ETH/USD is forming a bullish 5-0 pattern on the same timeframe, which hints at growth to reach $485. However, in order to complete the pattern, the asset may test $305 and then resume moving upwards.
Bitcoin
As we can see in the daily chart, Bitcoin has once again rebounded from an important support level; bears have failed to break $10,000 and continue pushing the price towards $8,000. The RSI has also rebounded from the support level, thus confirming further growth to reach $12,495. After breaking this level, the pair may continue growing towards $14,230. A strong signal in favor of this idea will be a breakout of the descending trendline and completion of the current descending correction. However, if the instrument breaks the rising channel’s downside border, the asset may continue trading downwards with the target at $8,790.
Photo: RoboForex / TradingView
In the H4 chart, the cryptocurrency is no longer moving within the descending channel. However, the RSI is testing the resistance line, that’s why one shouldn’t exclude another attempt of the asset to fall towards $10,540 and then reuse moving upwards. To confirm this bullish idea, the instrument must break the descending channel’s upside border and fix above $12,005. Still, this scenario may no longer be valid if the pair breaks $9,505 and the descending channel’s downside border. After that, Bitcoin may boost its decline. As a rule, a breakout of the descending channel to the downside is a very strong signal in favor of the further downward movement.
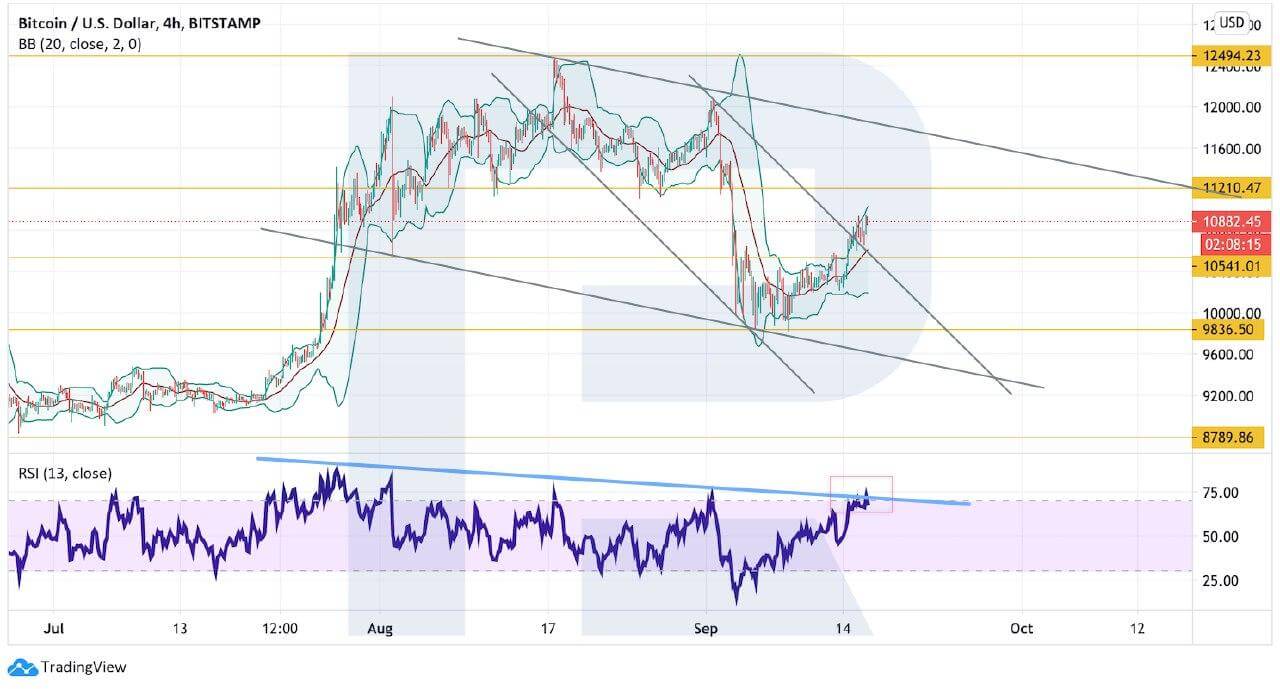
Photo: RoboForex / TradingView
Ethereum
In the daily chart, ETH/USD has rebounded from the downside border of the Bollinger Bands indicator but hasn’t broken the middle band yet, which would have indicated a resumption of the ascending tendency. Still, there is a potential for completion of a 5-0 rising pattern, which now lacks only a test of the rising channel’s downside border. A strong signal in favor of further growth will be a breakout of the trendline at the RSI. However, the bullish scenario may no longer be valid if the price breaks the support area and fixes below $250. In this case, the above-mentioned pattern will be canceled and the instrument may continue falling to reach $150.
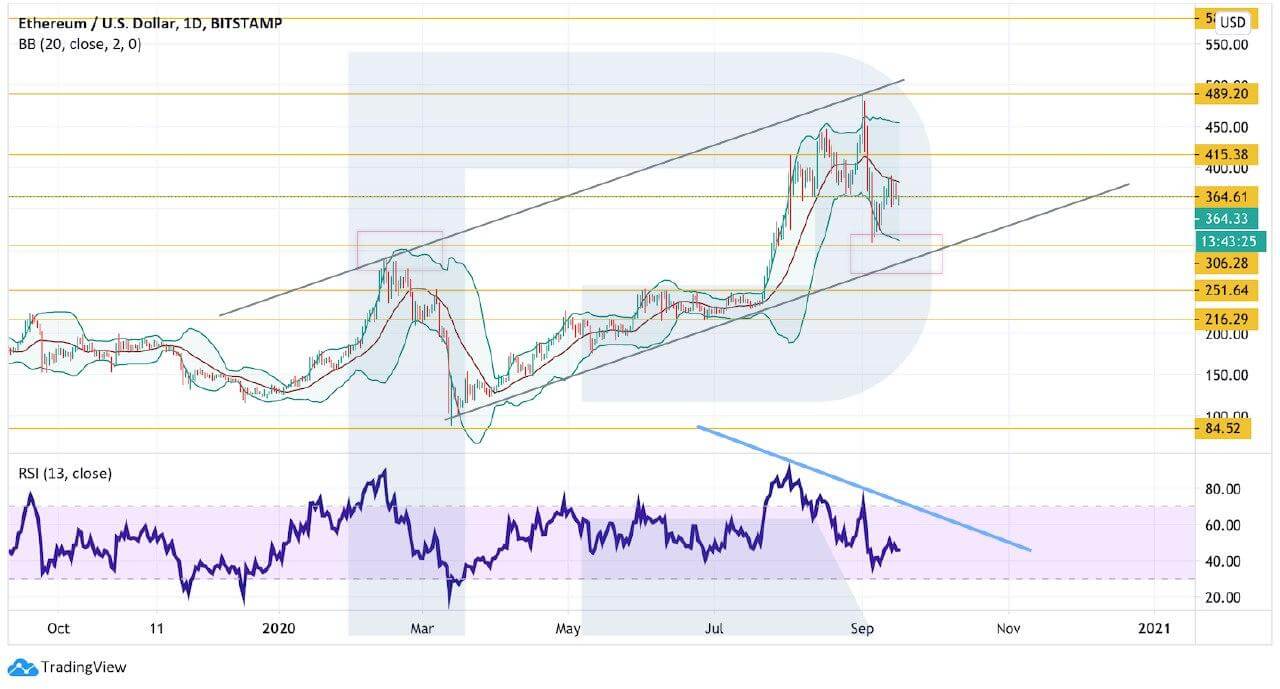
Photo: RoboForex / TradingView
On shorter timeframes, Ethereum is growing withing the descending channel. It’s too early to expect further growth as long as the price hasn’t broken the channel’s upside border and fixed above $415. Moreover, the RSI is testing the resistance line and may cause a decline towards $306. A breakout of this level may hint at a further downtrend with the target at $251.
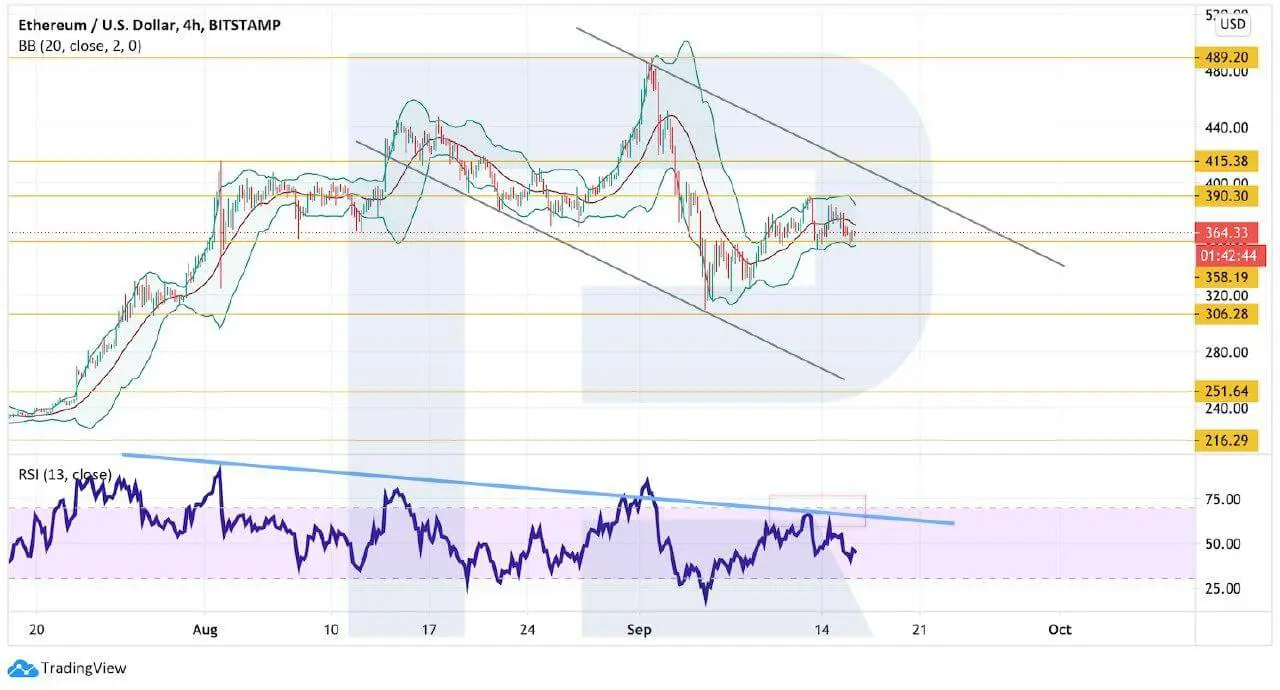
Photo: RoboForex / TradingView
Litecoin
In the daily chart, Litecoin is still correcting within a Head & Shoulders reversal pattern; the downside target remains at $38. There haven’t been any signals in favor of growth yet. As we can see, the RSI indicator hasn’t broken the resistance line, moreover, it hasn’t even tested the line. If the price breaks $38, it may continue falling to reach $24. To resume the uptrend, bulls must break the descending channel and fix above $60. In this case, the asset may continue trading upwards with the target at $76.

Photo: RoboForex / TradingView
As we can see in the H4 chart, LTC/USD is stuck inside a Triangle pattern. The RSI has rebounded from the resistance line, thus hinting at further decline from the current levels. To confirm the above-mentioned decline, the cryptocurrency must break the pattern’s downside border and fix below $45. However, this bearish scenario may no longer be valid if the price breaks the descending channel’s upside border and fixes above $51. After that, the instrument may continue trading upwards to reach $56.
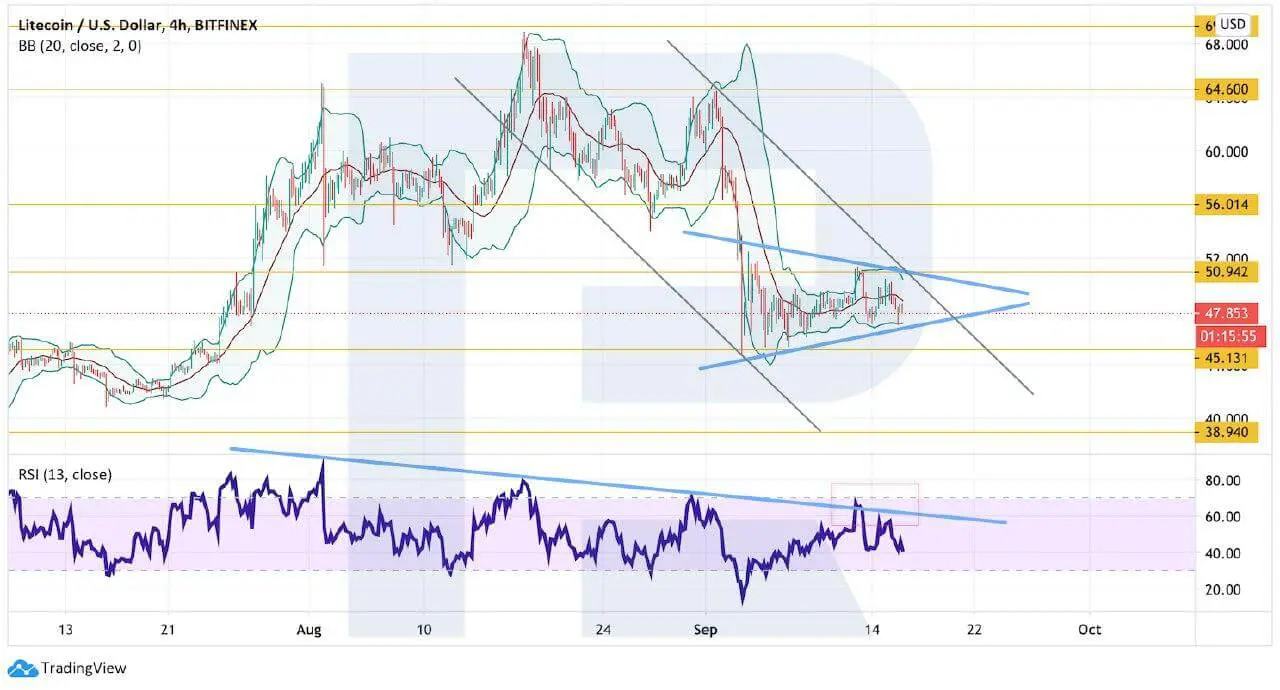
Photo: RoboForex / TradingView
TRON
As we can see in the daily chart, TRON is correcting but still moving inside the rising channel. There is a potential for a test of the channel’s downside border at $0.021 and further growth. Another signal in favor of this idea will be a rebound from the support line at the RSI. However, this scenario may no longer be valid if the price breaks the channel’s downside border and fixes below $0.017. In this case, the asset may continue trading downwards to reach $0.011.
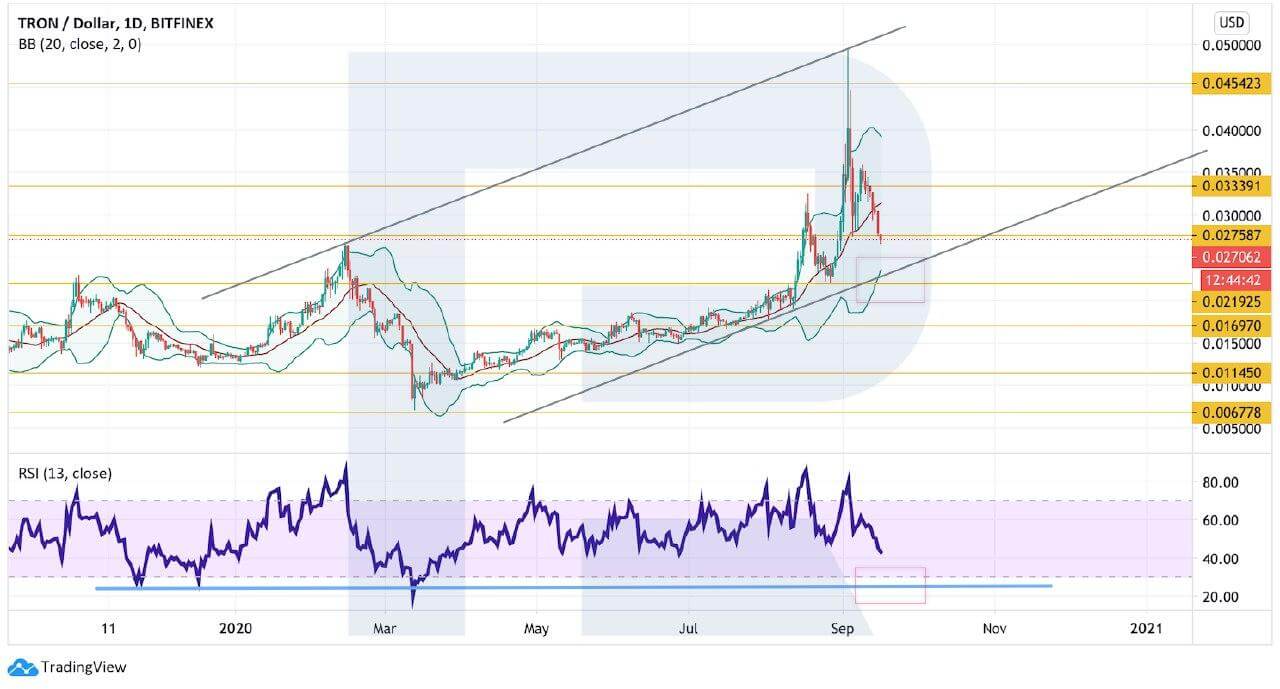
Photo: RoboForex / TradingView
On shorter timeframes, the asset is falling within the descending channel as well. There is also a potential for further decline towards $0.021. A strong signal in favor of this idea is another rebound from the descending trendline at the RSI. Still, this bearish scenario may be canceled if the pair breaks the descending channel’s upside border and fixes above $0.031. After that, the cryptocurrency may continue growing with the target at $0.036.
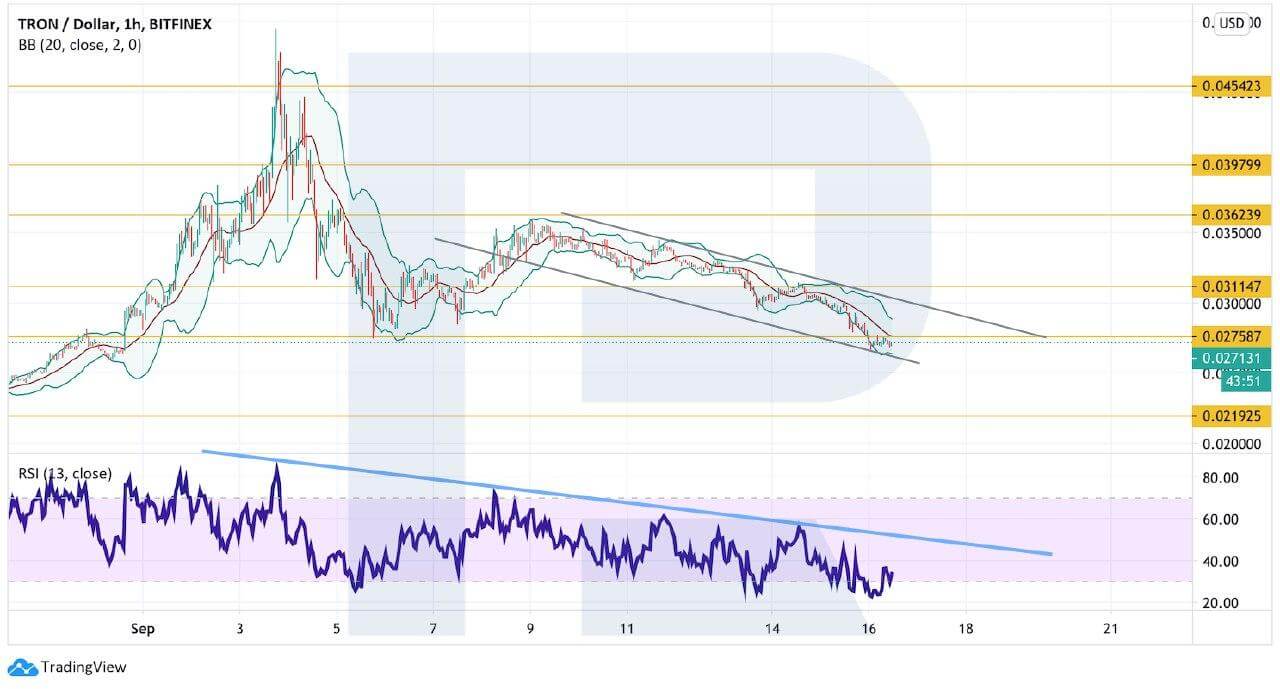
Photo: RoboForex / TradingView
EOS
In the daily chart, EOS is still testing the support area. After rebounding from the trendline, the RSI has failed to start a proper rising movement, that’s why one shouldn’t exclude a deeper decline towards $2.49 and then form another ascending structure to reach $3.17. However, this scenario may no longer be valid if the instrument breaks the support area and fixes below $2.49. In this case, the asset may continue falling with the target at $1.40.

Photo: RoboForex / TradingView
As we can see in the H4 chart, the cryptocurrency is falling within the descending channel and there is a potential for further decline towards $2.21. A strong signal in favor of this idea will be a rebound from the trendline at the RSI. Still, this scenario may be canceled if the asset breaks the channel’s upside border and fixes above $3.17. After that, the pair may continue moving upwards.
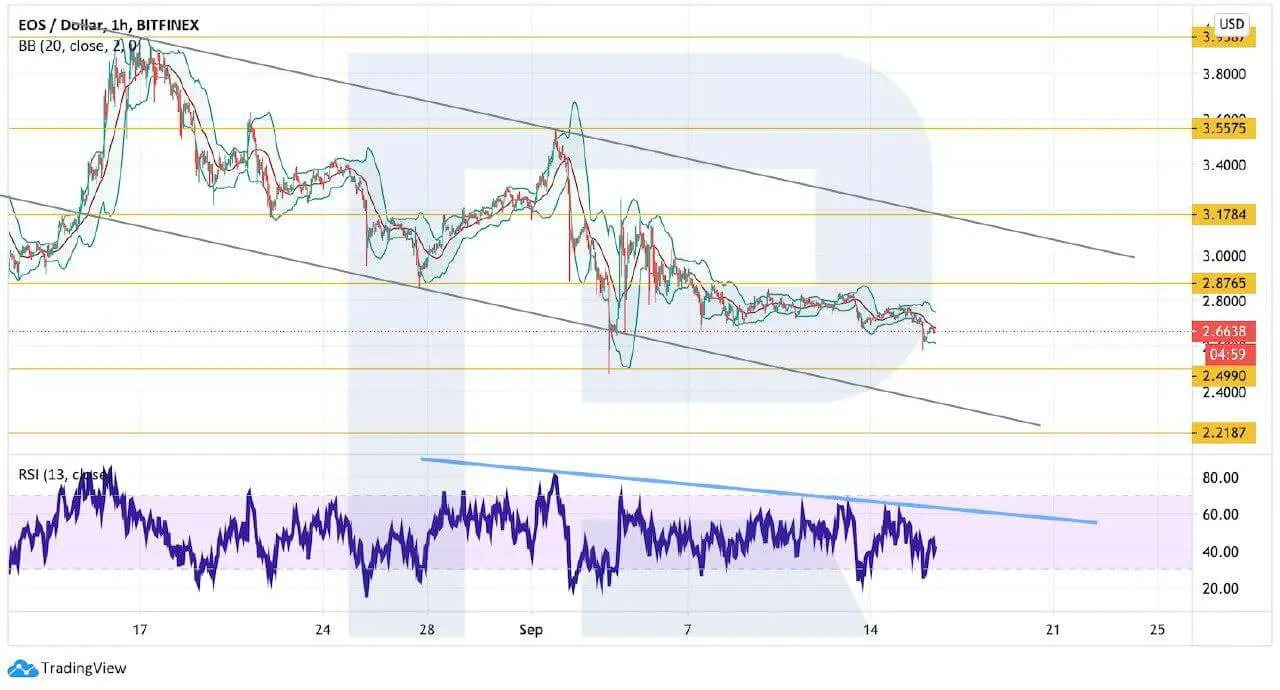
Photo: RoboForex / TradingView
Disclaimer: Any predictions contained herein are based on the authors’ particular opinion. This analysis shall not be treated as trading advice. RoboForex shall not be held liable for the results of the trades arising from relying upon trading recommendations and reviews contained herein.

Dmitriy Gurkovskiy is a senior analyst at RoboForex, an award-winning European online foreign exchange forex broker.

