
Crypto analyst Egrag has published a new short-term price prediction for XRP, indicating a possible rise should the price overcome a critical technical hurdle. Egrag’s analysis looks at the 12-hour chart of the XRP/USD trading pair, where a trend channel breakout could trigger a short-term buy signal.
XRP Price Breakout Imminent?
According to the crypto analyst, the price has recently been moving within a descending channel (DC). Now, XRP is at an inflection point that could have a significant impact on its price. Egrag has identified the structure as “DC B”, a bearish pattern where the asset has formed lower highs and lower lows.
A key focus of Egrag’s analysis is XRP’s interaction with this pattern. Since the beginning of the chart pattern, the price has twice touched the upper trend line, which serves as resistance, and twice touched the lower trend line, which serves as support.
Currently, the XRP price is about to retest the upper line of the trend channel for a third time. Should it succeed in breaking out of the downtrend channel, this would be an extremely bullish sign. From mid-July to the end of October, the price was already in a descending channel, which Egrag refers to as “DC A” in the chart.
After XRP broke out of the downward channel A, the price rallied by over 50%. Something similar could happen now if history repeats itself. Egrag explained, “XRP seems to be mirroring its previous price action within a descending channel (DC). Check out the chart below to see how price is attempting to break out of DC B. The next challenge for XRP is to surpass descending channel B to reach Fib 0.5.”
What’s Next?
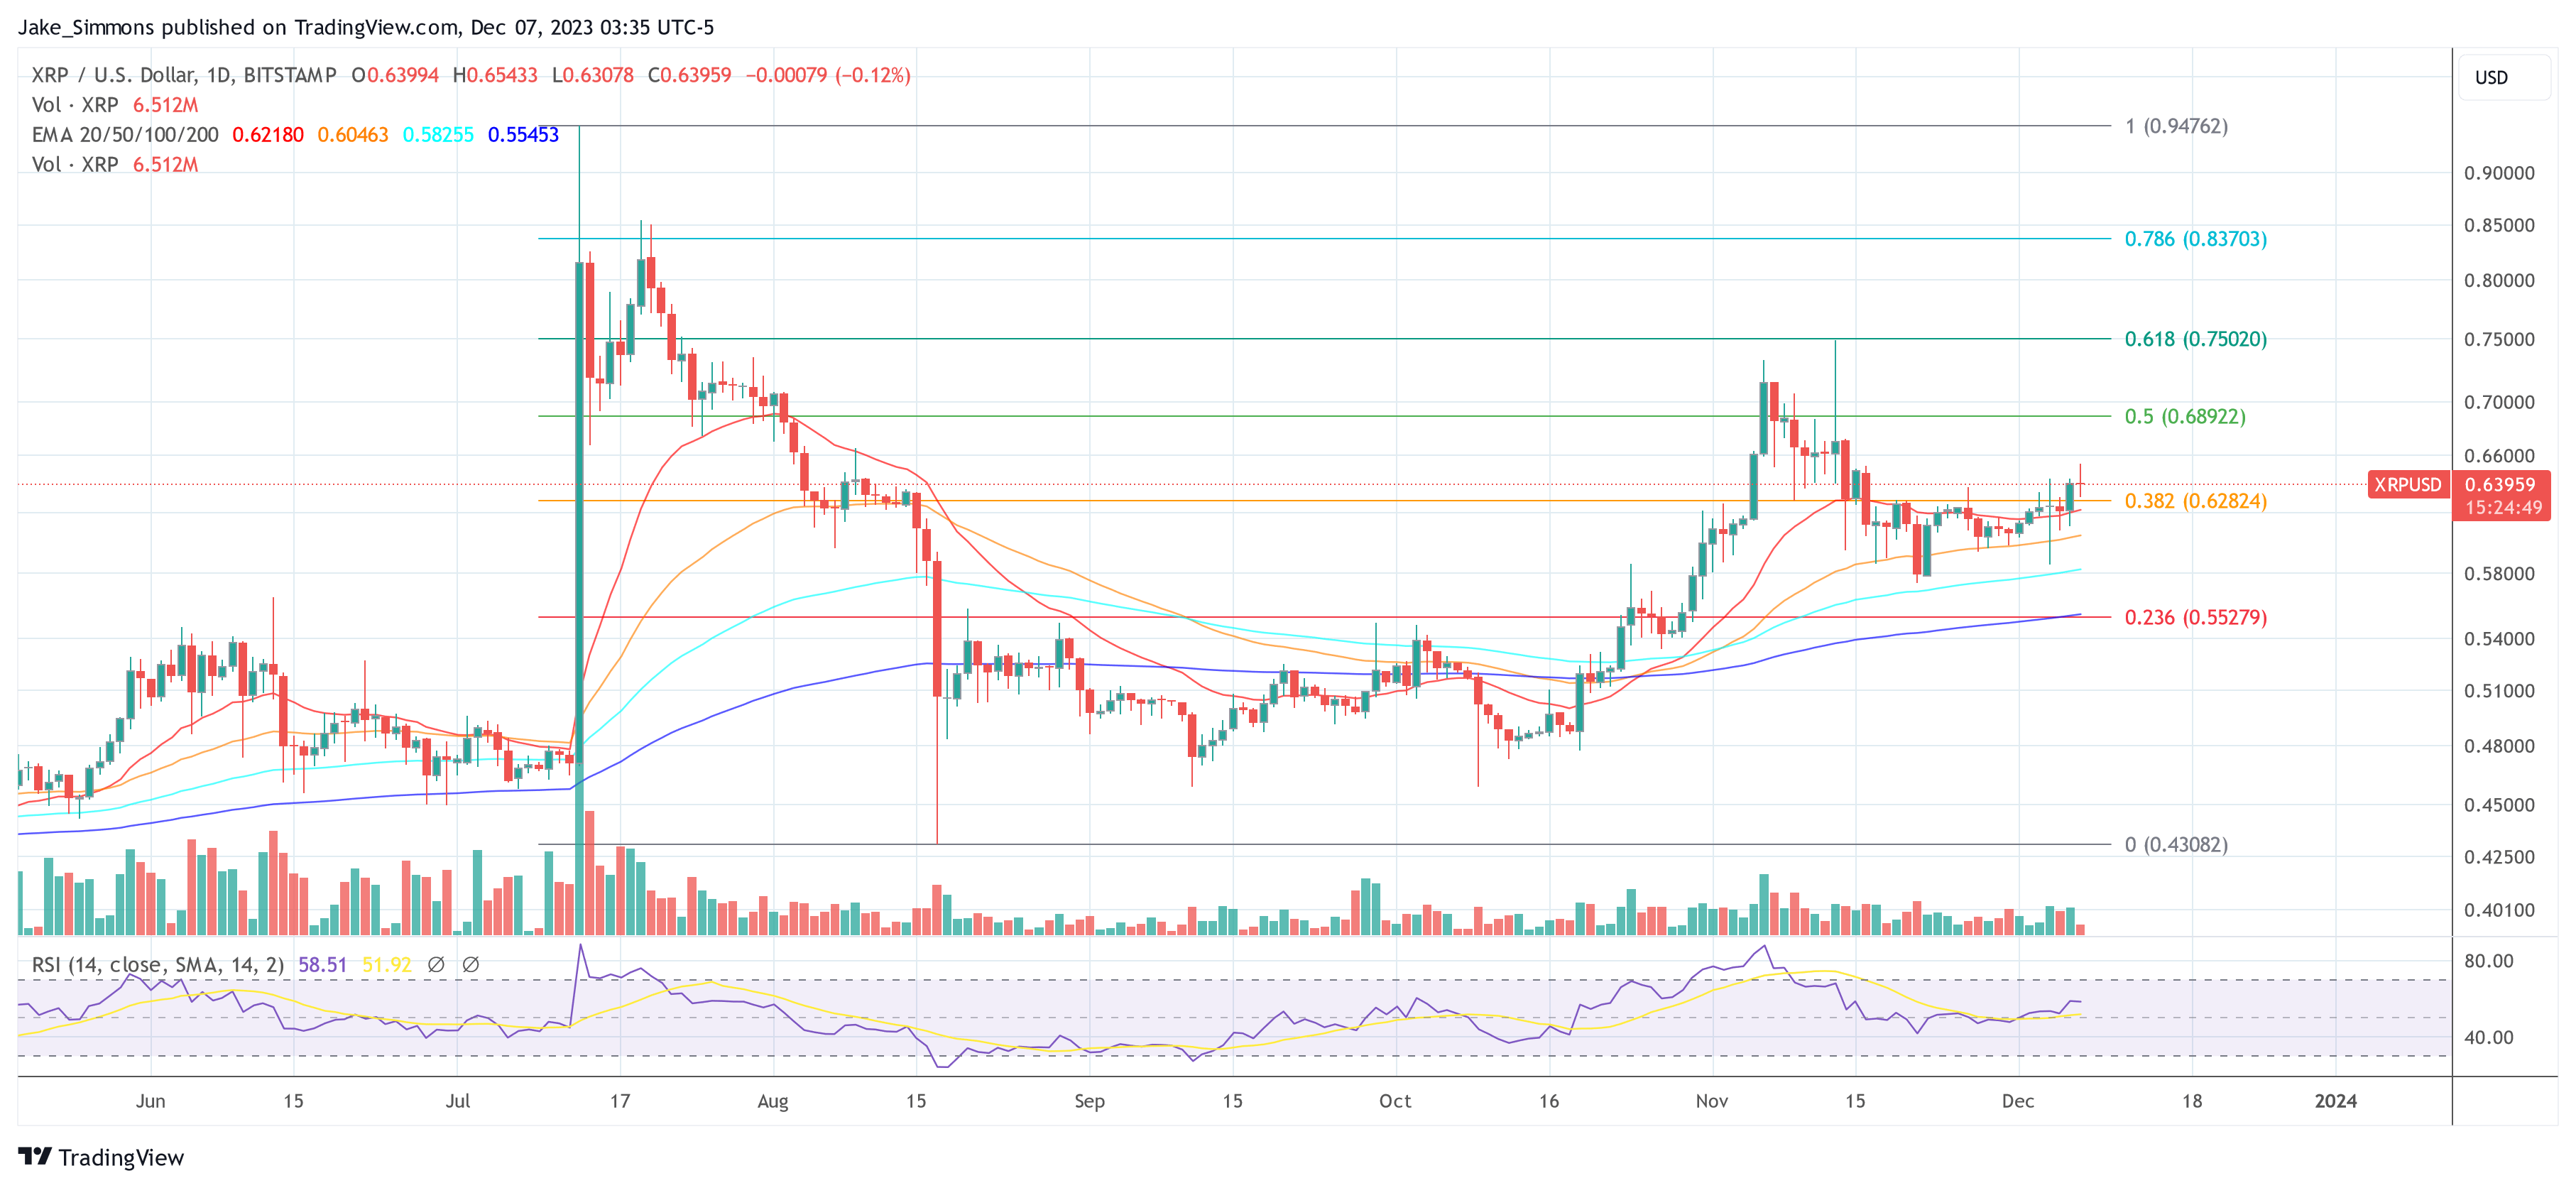
Should a breakout succeed, the 0.5 Fibonacci retracement level at $0.7529 would be the next major resistance in Egrag’s chart. An upward breakout above this level could indicate the start of a trend reversal that could drive the price towards the $1.30 to $1.50 range.
“A breakthrough past the 0.5 Fibonacci level hints at upward momentum, signaling a shift from a downtrend to a potential uptrend, instilling confidence. […] Pay close attention: Fib 0.5 at a price target of 0.7529c could be the gateway to a potential move towards 1.3-1.5$,” Egrag explains, suggesting that such a move would be an important indicator for traders.
In conclusion, Egrag advises investors to keep a close eye on trading volume and overall market sentiment, as these factors will play a crucial role in the asset’s ability to reach and exceed these crucial levels.
At press time, XRP traded at $0.63959.
Featured image from Shutterstock, chart from TradingView.com

