Chainlink is the best performing crypto asset of the top ten cryptocurrencies by market cap in 2020, and the years prior since it first came into existence. And although the peak in 2020 could very well be in for now, and a massive rejection just occurred at a pivotal mathematical level, a bullish chart pattern forming would have a target of roughly $32 per LINK if it breaks to the upside.
LINKUSD Rejected At 0.618 Fibonacci Retracement Level, Triangle Forms
After Chainlink charged headfirst into $20, the asset’s current peak, it’s been reeling since. Bitcoin set a new higher high for 2020, but the once-unstoppable cryptocurrency altcoin Chainlink has been much weaker by comparison.
Related Reading | Crypto Trader Offers Roadmap To Chainlink Buckling Against Bitcoin
A nearly 60% plunge from $20 to just $8 was bought up fiercely from crypto investors hoping for a second wind or for a long-term hold. Those that did so, are still well in profit after LINKUSD surged from $8 to $13 at the peak.
Chainlink rejected at 0.618 Fibonacci retracement level | Source: LINKUSDT on TradingView.com
A strong rejection at the 0.618 Fibonacci retracement level, however, could send the altcoin tumbling further.
Fibonacci retracement tools are used to find potential support and resistance areas, which can act as reversal points. When an asset’s price touches the order block acting as resistance, a rejection sends the asset back to retest lower.
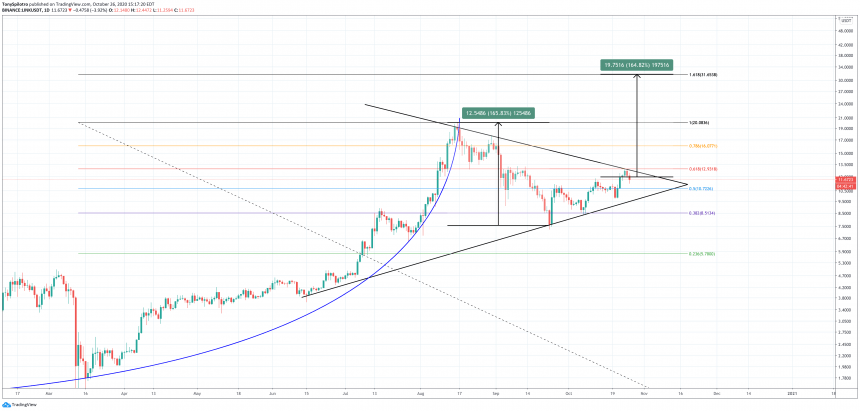
That’s exactly what is happening on the LINKUSD trading pair. The latest rejection might have revealed a downtrend line – validated with three separate touches – that is converging tightly with a lower trendline that sent Chainlink parabolic in mid-2020. The converging trendlines have formed what appears to be a symmetrical triangle– a bullish continuation pattern.
Fibonacci Extension Target Could Send Chainlink Flying To $32
Symmetrical triangles are typically bullish continuation patterns, signaling upside ahead. However, they can break down with severity.
Using the measure rule, taking the width of the symmetrical triangle that’s formed and applying it to an estimated breakout point, would indicate a rise of over 150% to as high as $32 per LINK.
Related Reading | Chainlink Following In 2017 Ethereum Footsteps Could Fuel Rise To $75
The target of the geometrical shape also coincides with yet another mathematical solution: the 1.618 Fibonacci extension level.
Triangle target would line up with 1.618 Fibonacci extension | Source: LINKUSDT on TradingView.com
Fibonacci levels are ratios of an asset’s price based on a sequence of numbers where each are the sum of the previous two numbers. For example, 3, is the sum of 1 and 2.
These ratios are found all over the world and in nature. The 0.5 and 0.618 Fibonacci levels are especially important for trading, as this is a level where if an asset’s price passes through it, a recovery and new highs are likely, while a rejection from the level could mean new lows.
If Chainlink can get back above the 0.618 level, it could head for the 1.618 extension next.
Featured image from Deposit Photos, Chart from TradingView.com


