
An analyst has pointed out how Chainlink is forming a TD Sequential sell signal right now, which could lead to a retracement to this level.
Chainlink Could Decline To $12.50 Following The Sell Signal
As explained by analyst Ali in a new post on X, LINK could be heading toward a correction based on what the TD Sequential signal says. The “Tom Demark (TD) Sequential” is a popular indicator in technical analysis that is used to pinpoint reversals in the price of any asset (which, in the current discussion, is naturally Chainlink).
The metric gives a signal whenever the asset has seen nine candles following a reversal in its price. The signal is a sell one if the candles are green, while it’s a buy one if the candles are red.
This phase is called the “setup phase.” Once the setup is done, a 13-candle long countdown phase kicks off. At the end of these 13 candles, the price could be believed to have hit another probable bottom or top (depending on whether the phase started with a sell or buy signal).
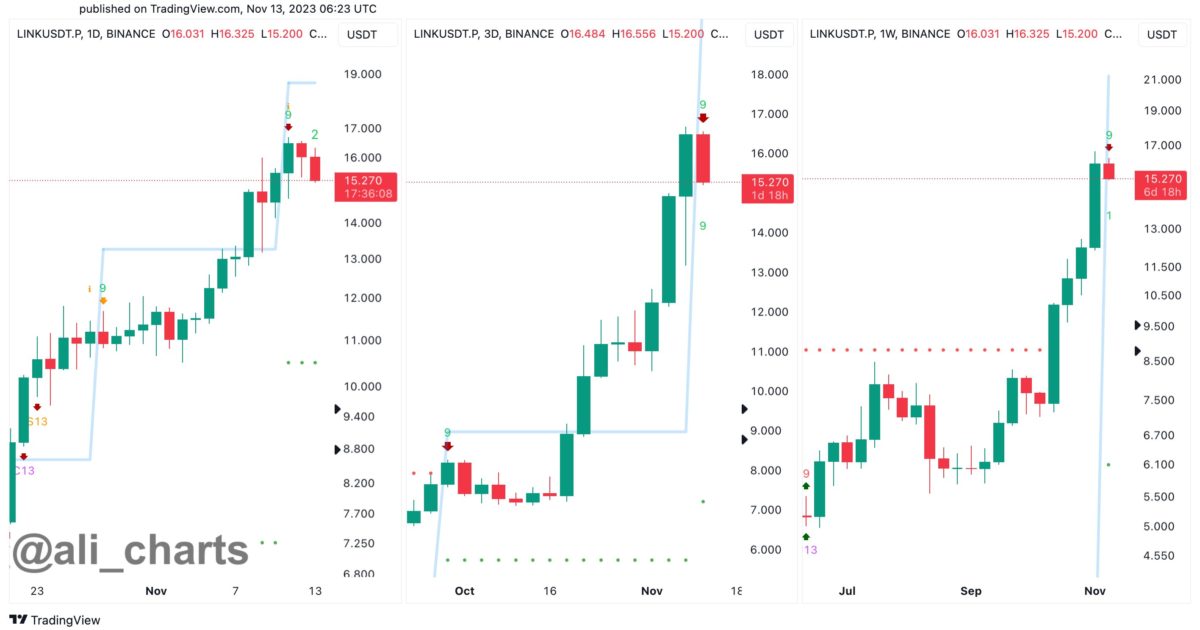
Chainlink has recently been enjoying some very rapid growth, which has led to the asset’s price hitting heights not seen since April of last year. This run, however, may be going toward at least a temporary setback, as according to Ali, a TD Sequential setup phase seems to have finished for the cryptocurrency recently. The signal has in fact appeared on not just one, but three of the coin’s price charts: daily, 3-day, and weekly.
Here are the charts as shared by the analyst:
LINK appears to have completed a TD-9 setup | Source: @ali_charts on X
As displayed in the above graph, the Chainlink TD Sequential setup phase has finished with green candles on all of these LINK charts, implying a reversal towards the bearish side may be imminent for the cryptocurrency.
Ali anticipates that the retracement would be towards the $12.50 level, which would mean a drawdown of more than 18% from the current price level of the asset. “Failing to hold above this critical support area could extend the losses to $10.50,” the analyst further adds.
Such a decline all the way to $10.50 would suggest a decrease of over 31% for Chainlink, but even if such a steep drop happens, LINK still wouldn’t have fully undone the recovery it has made since the last third of October, showing just how sharp the asset’s bullish momentum has been recently.
It now remains to be seen what trajectory the asset takes from here considering this bearish signal. So far, chances are not looking in the favor of the coin, as it has seen two red candles already since the pattern has formed, implying that the countdown phase might have begun.
LINK Price
Chainlink had risen above the $16.5 mark during the weekend, but the coin has taken a hit in the past day as it’s now close to the $15 level.

LINK has more than doubled during the past month | Source: LINKUSD on TradingView
Featured image from Shutterstock.com, charts from TradingView.com


