As the price of Bitcoin (BTC) was retracing from the massive rally four weeks ago, no clear indications were seen on the charts of a potential reversal. Thus, the price started to accelerate downwards to the next support areas, causing the price to drop $1,000 within one day.
Crypto market data. Source: Coin360
However, is the bear market imminent, or is it still applicable to state that this is a bull market retracement? Let’s analyze the charts.
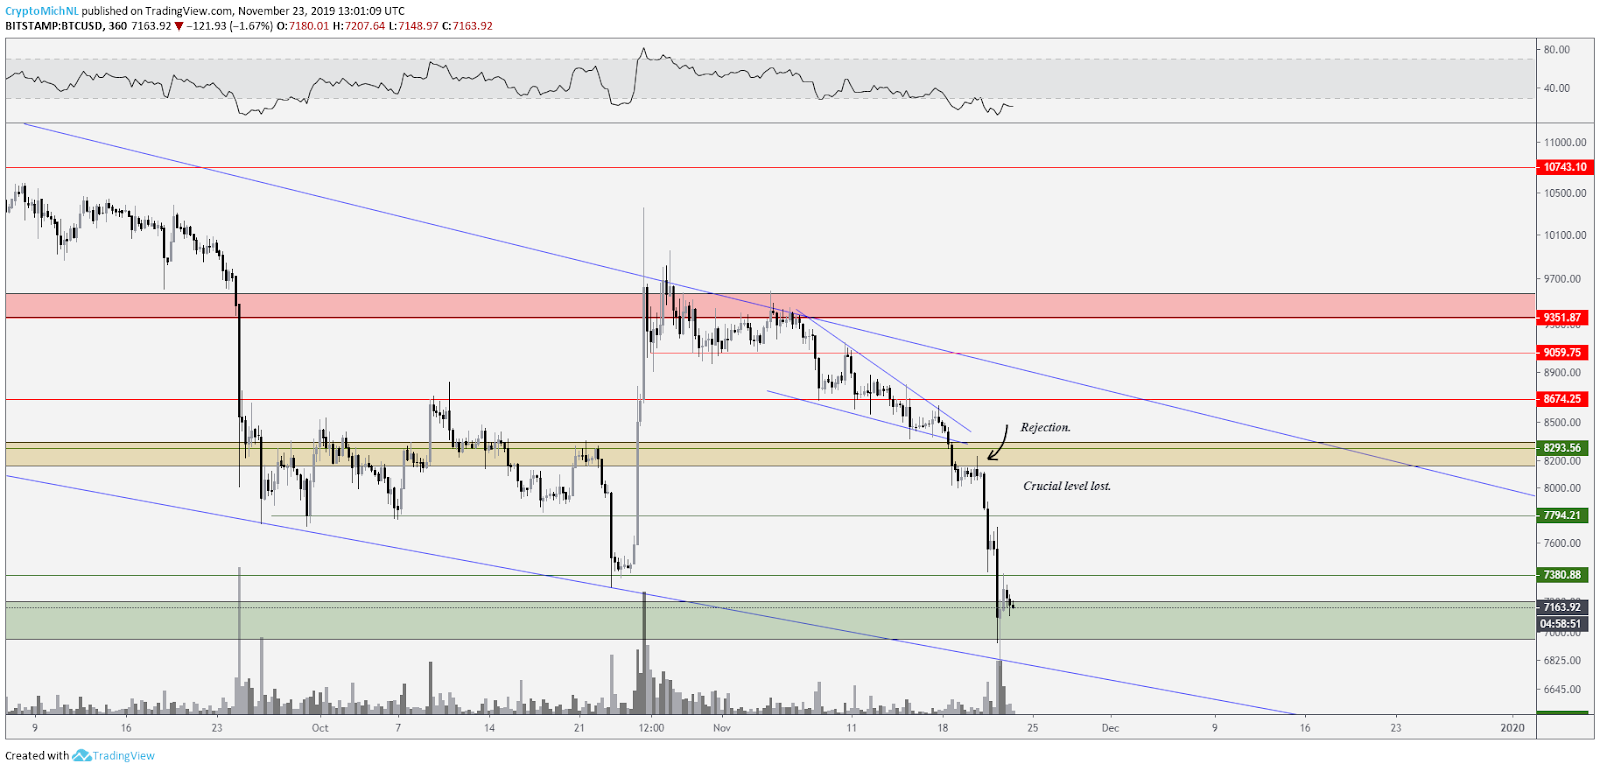
Bitcoin lost crucial $8,200 support level
As discussed in the previous article, the bearish scenario provided opportunities to potentially short the market.
BTC USD 6-hour chart. Source: TradingView
Through this, the falling wedge structure wasn’t confirmed, and the price fell below the support zone (yellow area). After that, a small rejection was seen before the price started to fall through to the next critical support zone. This zone is marked in the green area and can also be defined through the trendline (blue line).
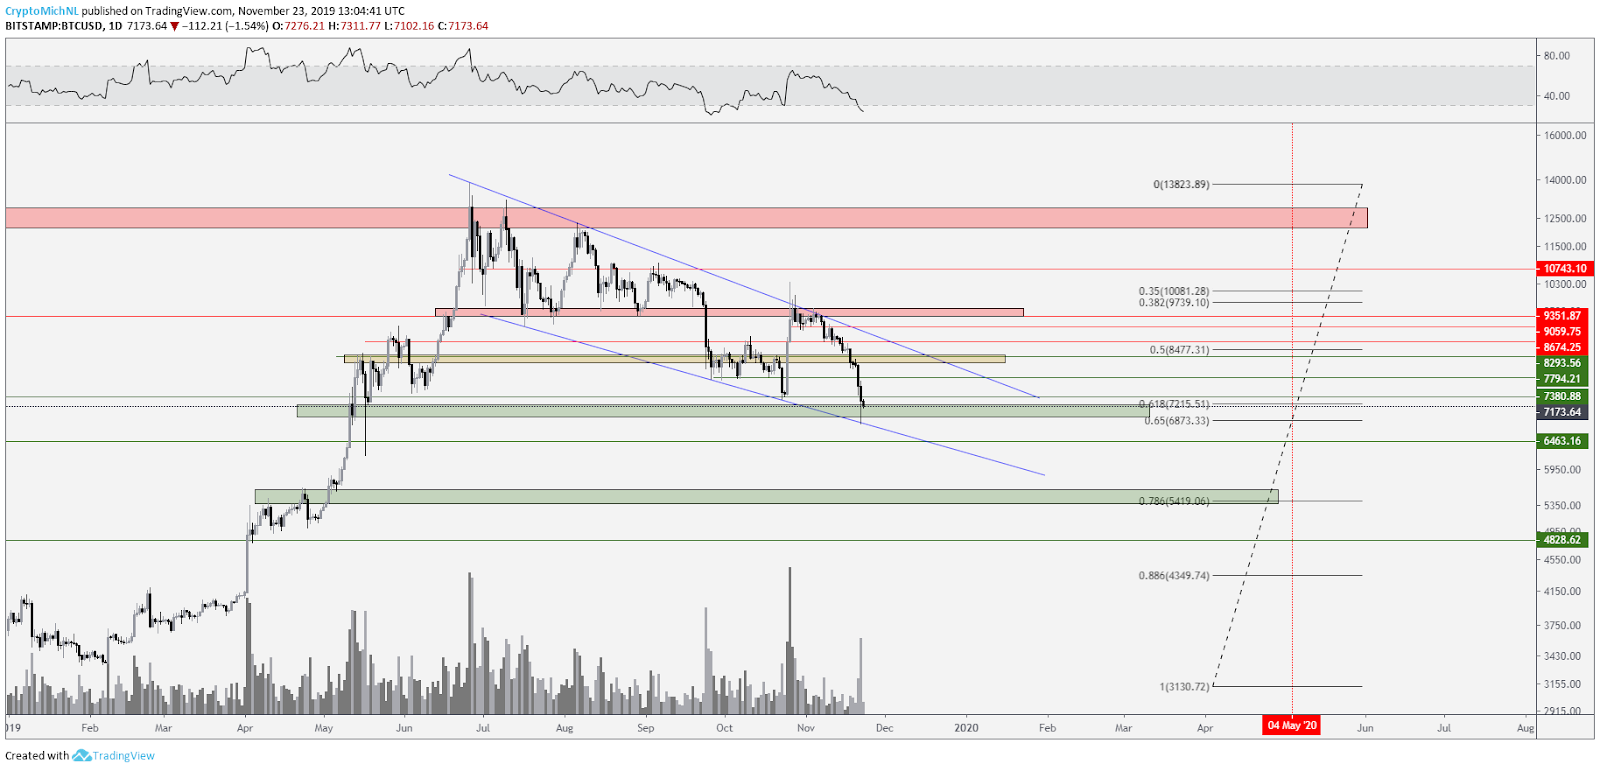
However, daily timeframes show that the price has retraced to the golden ratio (0.618-0.65 Fibonacci level) of the whole upwards move during the first half of 2019 ($3,000 to $14,000).
BTC USD daily chart. Source: TradingView
In this chart, it can be seen that the price couldn’t clear back up above $9,300, which caused the price to retrace downwards. By losing the $8,200 support area, the price started to accelerate down towards the next critical support zone around the 0.618-0.65 Fibonacci level.
Aside from that, the price is still stuck inside a big downwards trending channel, making lower lows and lower highs, which can be considered bearish.
Golden ratio retracements occur frequently
However, golden ratio support levels are significantly healthy in general and have shown up frequently in the Bitcoin market.
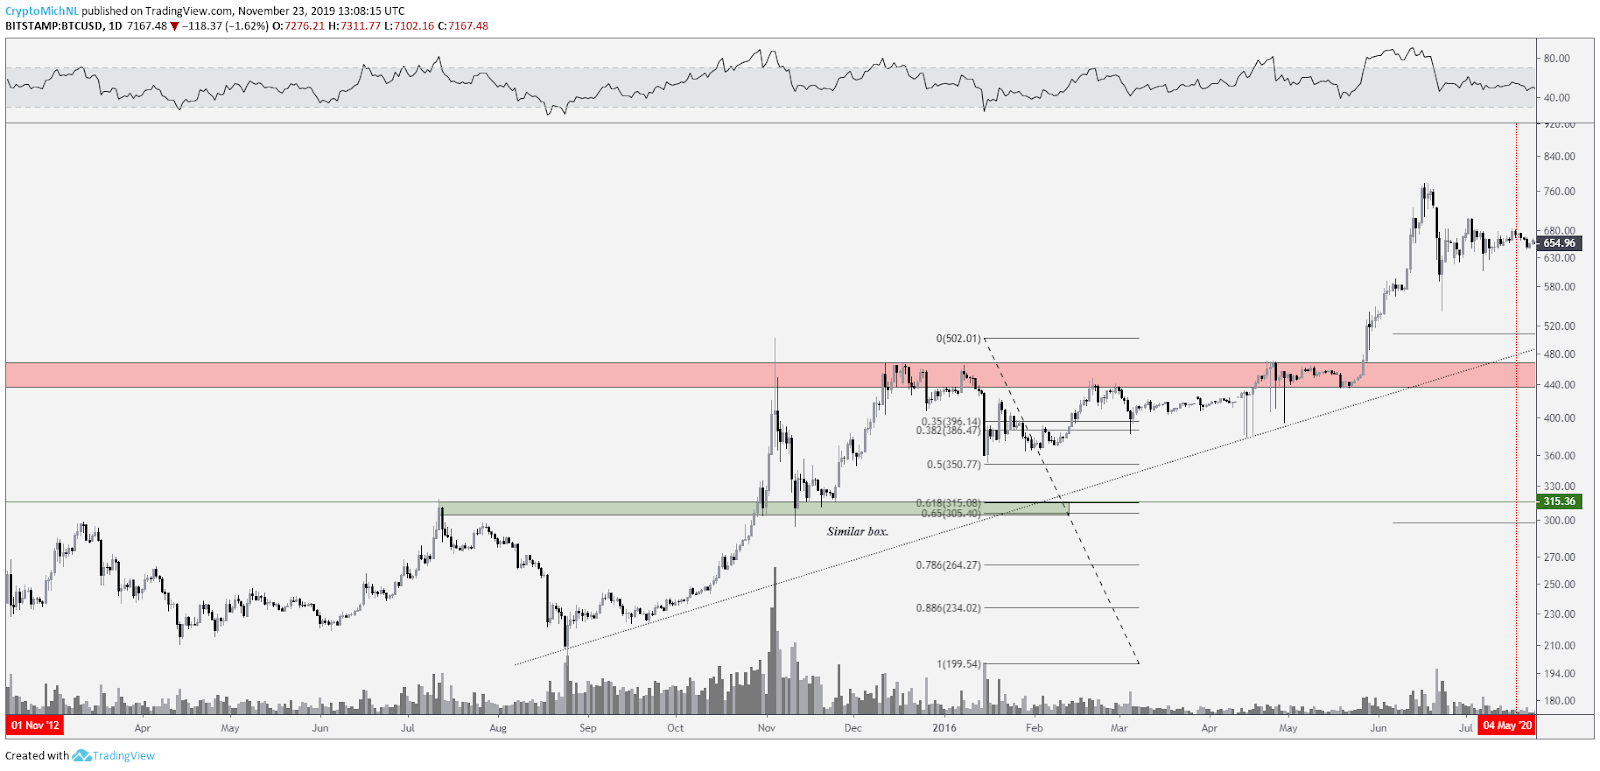
For example, the first parabolic move in 2016 retraced down towards this crucial Fibonacci level, as seen in the following chart.
BTC USD 2016 Chart. Source: TradingView
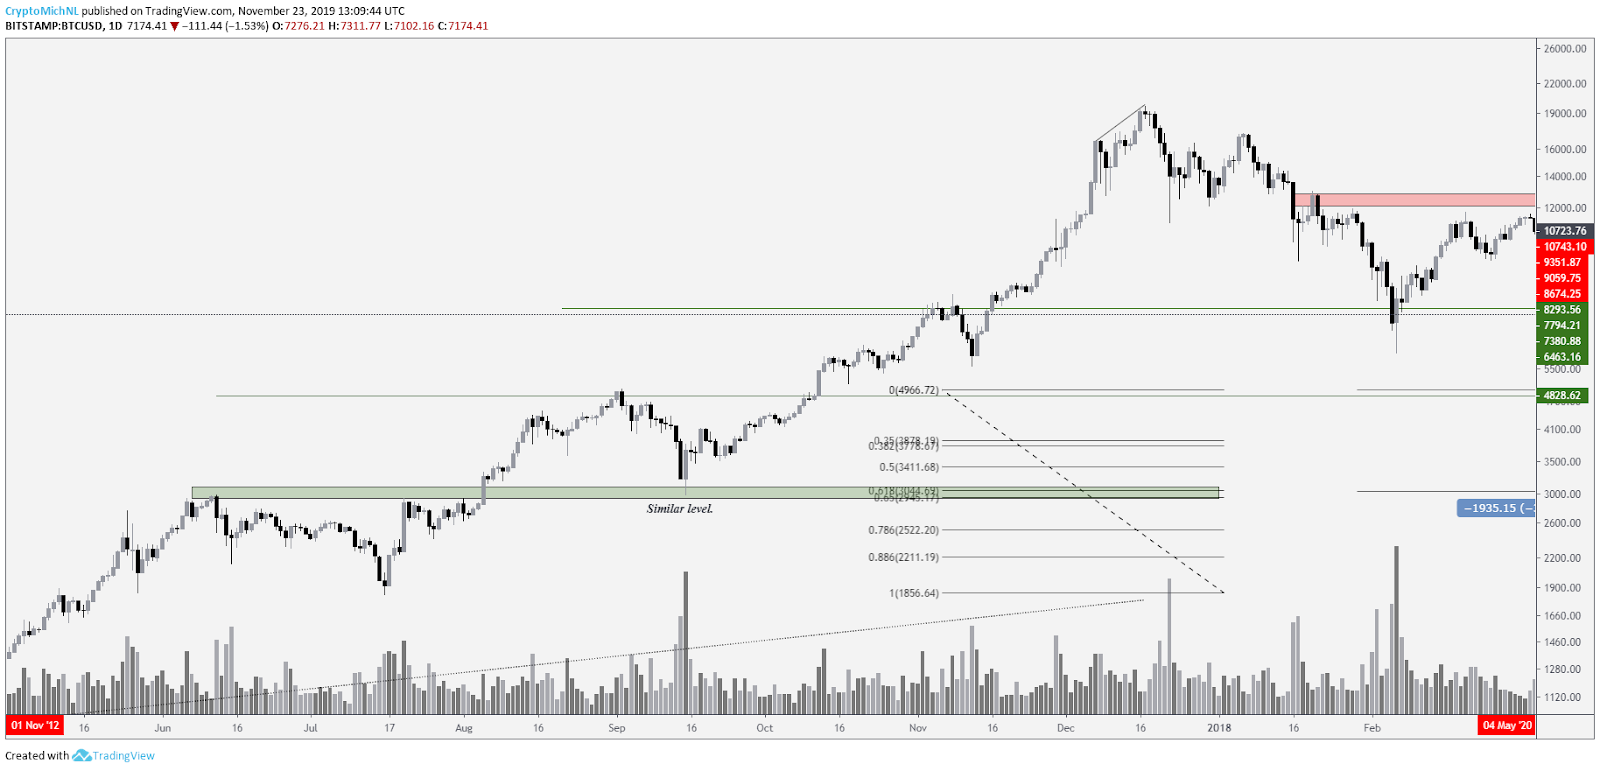
Another example is seen during the 2017 bull market when the price retraced towards the 0.618-0.65 Fibonacci level on news of a potential Chinese “ban” dropping from $5,000 to $3,000.
BTC USD 2017 Chart. Source: TradingView
More examples are found in the charts (also from prior market cycles). So can it be stated that this is a bottom call?
No.
But this does show the significance of this key level. Combined with the fact that the overall sentiment is back to “extreme fear,” a potential “buy the dip” scenario could present itself in these zones. Many investors have been dying to buy at these levels earlier this year.
Macrotrend still unbroken
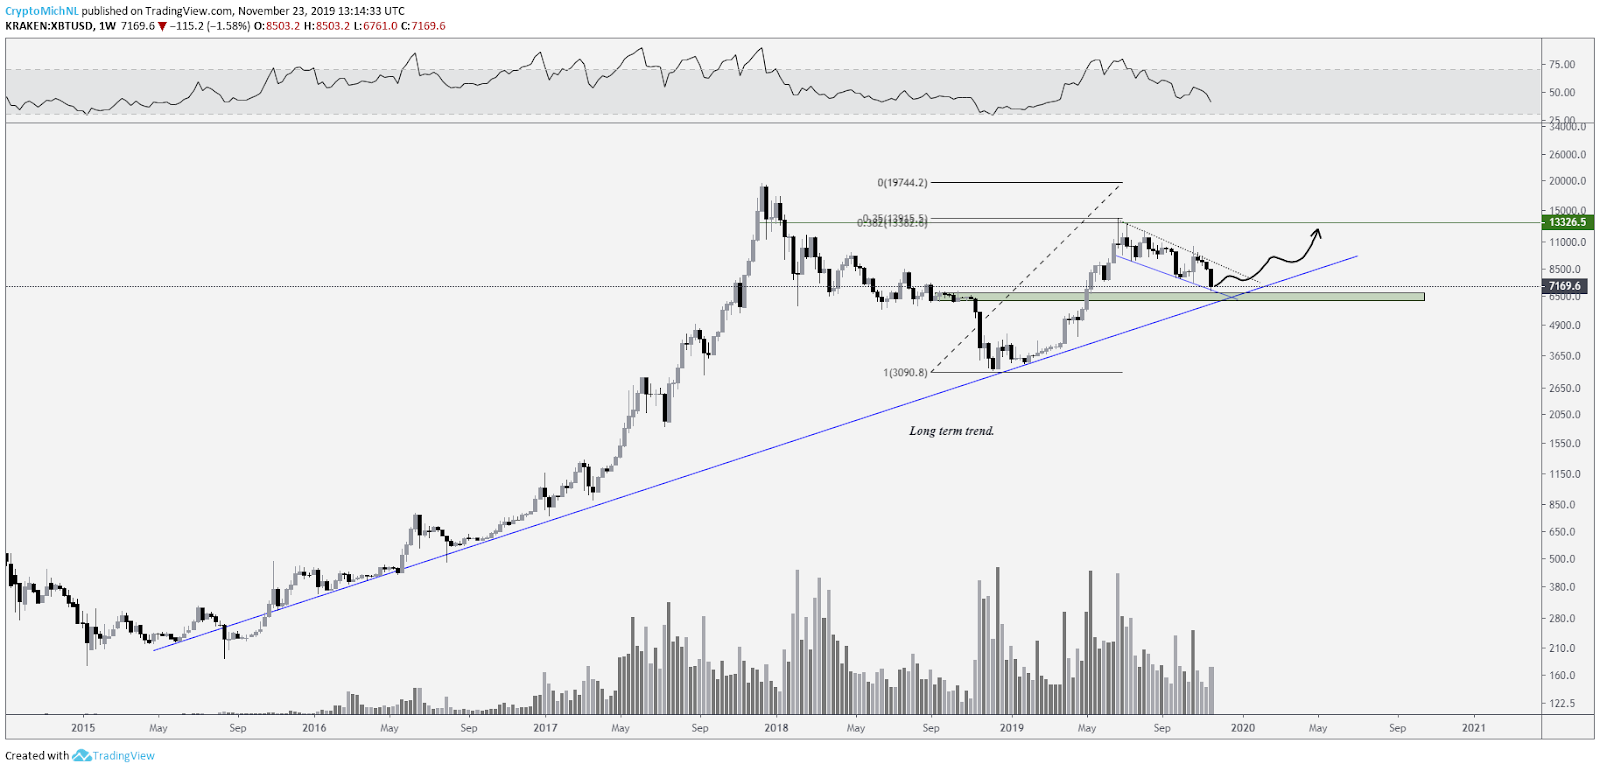
BTC USD Macro view. Source: TradingView
This chart shows the macrotrend since the beginning of 2015. The trend marked the bottom of the bear market in December 2018, as the price jumped up from there and started to rally upwards to the recent high of $14,000 in June 2019.
Interestingly enough, the move from $3,000 to $14,000 also bounced back from the similar Fibonacci level, once again showing the significance of the golden ratio.
Bitcoin has to maintain the green zone (which is the order block between $6,000 and $6,800) as support on the weekly timeframe and needs to keep the blue trendline as support.
If this holds, the price looks ready to continue its overall upward trajectory and targets of $14,000-20,000 would remain on the table for next year.
Bullish scenario
However, what does BTC/USD need to do on shorter time frames to make the chart look more attractive?
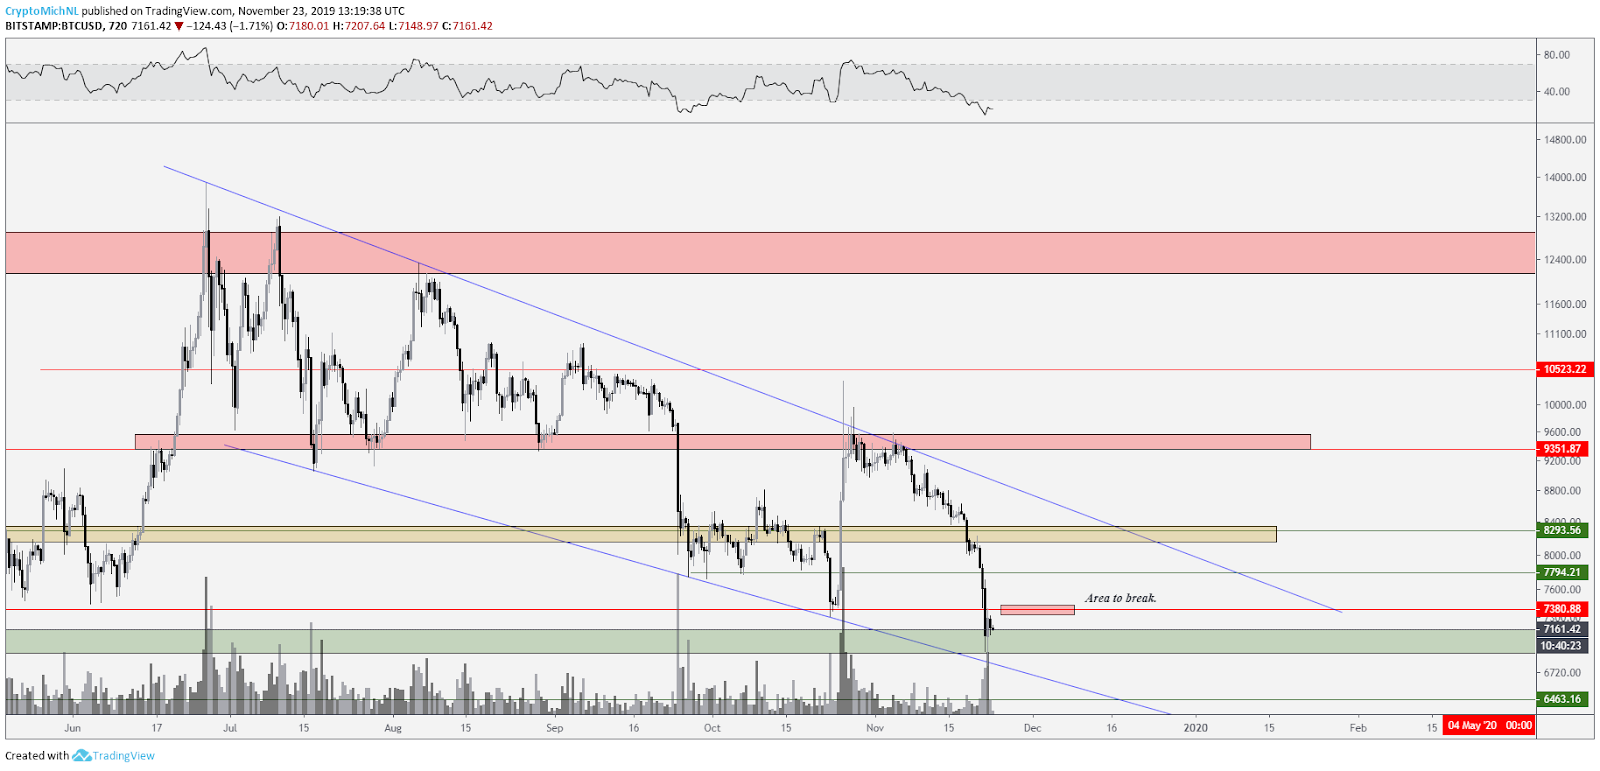
BTC USD 12-hour chart. Source: TradingView
The first step before any major U-turn would be clearing the $7,350-7,400 area. If Bitcoin can break to the upside here, continuation is likely towards $7,800, and a temporary bottom would be achieved.
In that regard, continuation in this channel is likely, which suggests that BTC will have a few more months of sideways action in this area (between $6,900 and $8,200). The reasoning is simple: the other trendline of the channel is quite far away from here, implying that it would take until January before that zone is reached.
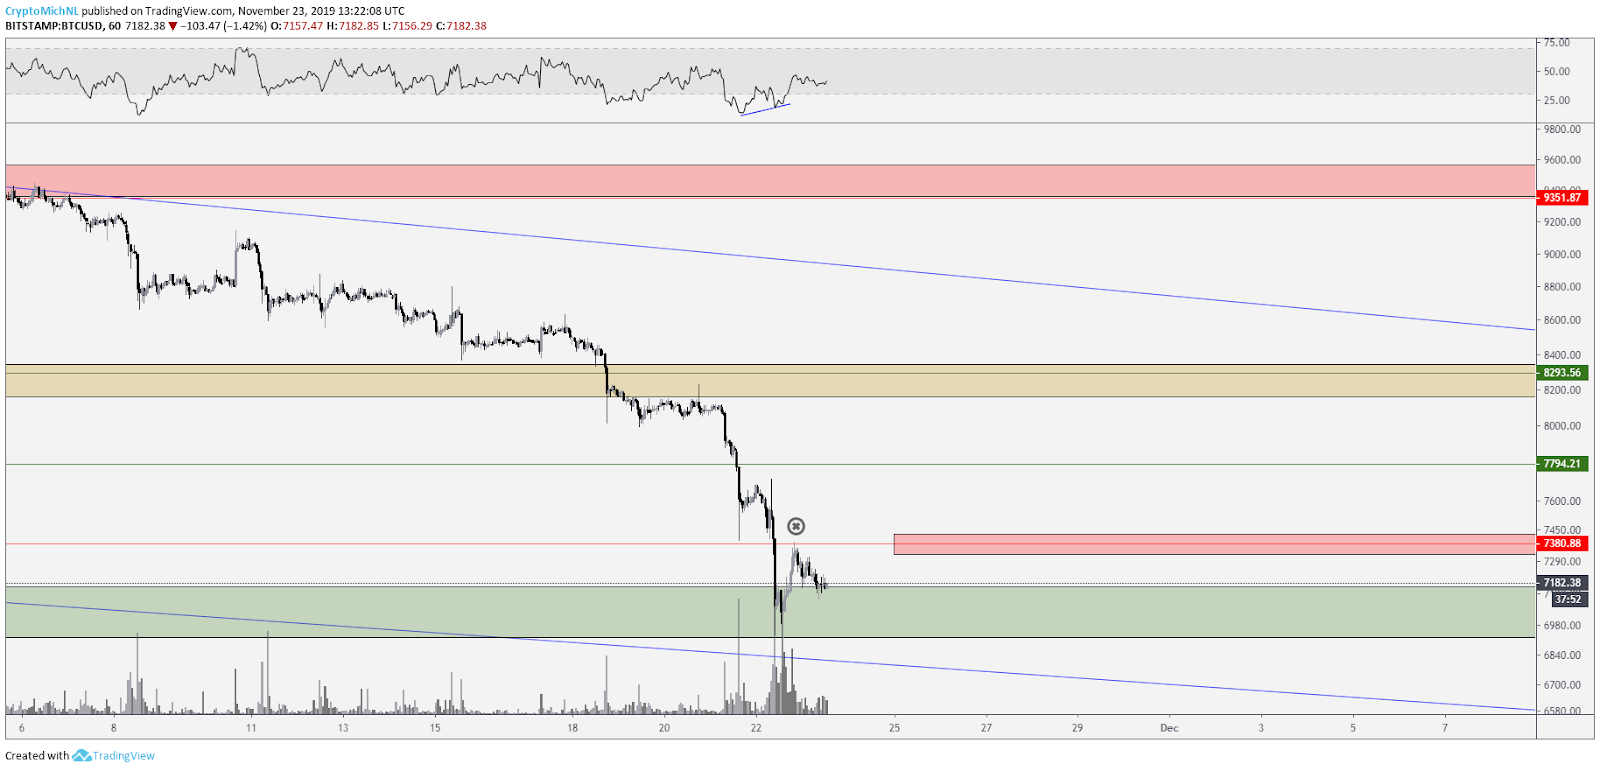
BTC USD 1-hour chart. Source: TradingView
On the smaller time frames, only a bullish divergence on the 1-hour chart is found for any reversal signals. Aside from that, a move of $500 already confirmed this bullish divergence.
However, the price couldn’t break up above $7,400, which is needed for any short term reversal, as discussed above.
On the smaller time frames, a higher low needs to form to retest the $7,400 again. If this level is broken, targets for bullish movements are found at $7,800 and $8,200.
Bearish scenario
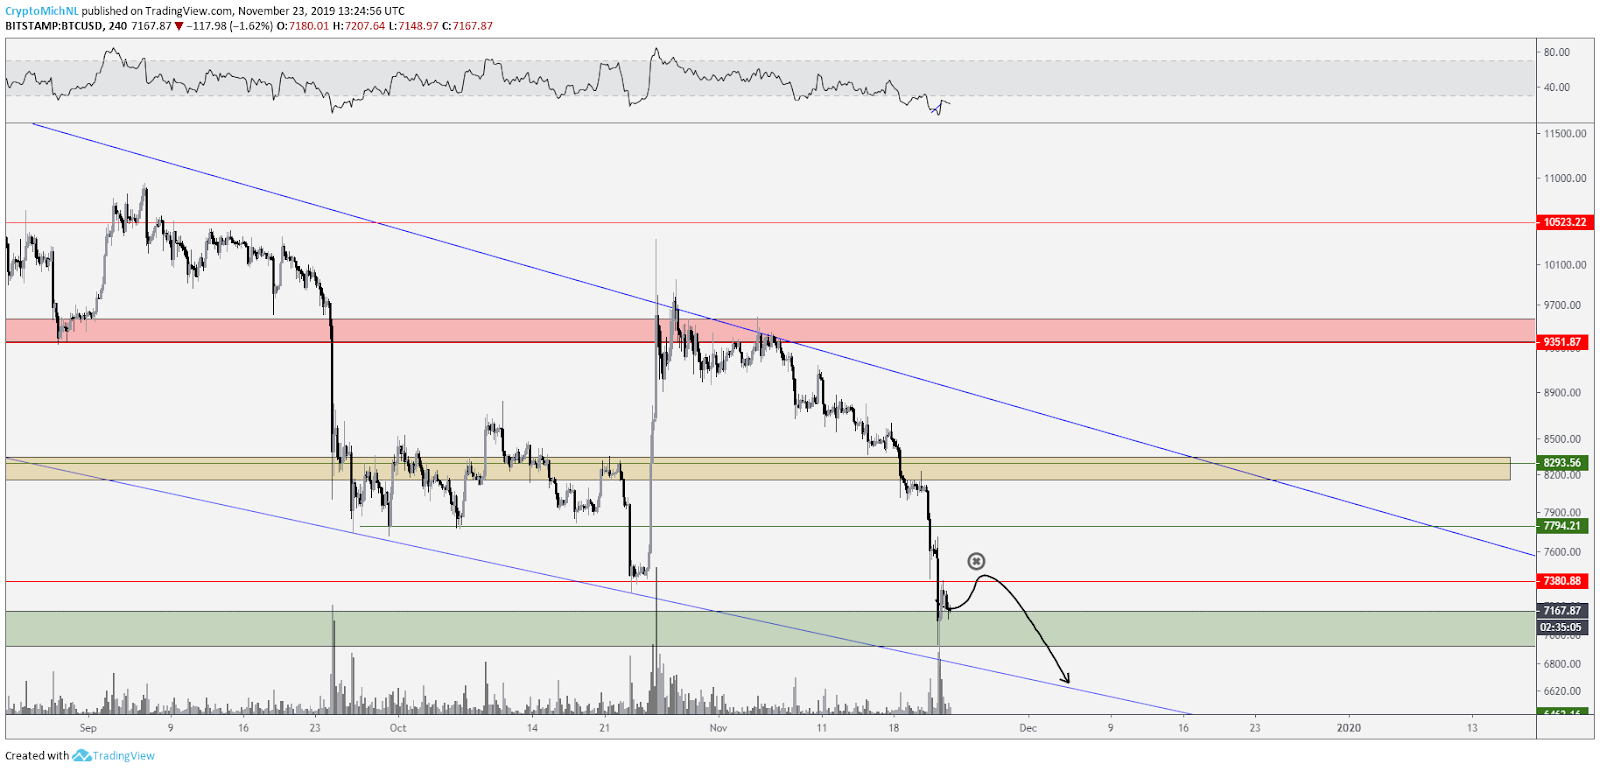
BTC USD bearish scenario. Source: TradingView
Nevertheless, the price is still trending downwards in a substantial manner, so the recent price action is classified as bearish.
If the price is not able to break through $7,400, further downwards pressure is expected. In that regard, targets of $6,600-6,800 are back on the table for a potential long entry, in which the lows are swept and liquidity is taken back again.
In this potential downwards move, another retest of the trendline would occur, and potential bullish divergences can be built on higher time frames as well.
Conclusion
Since the overall sentiment is bearish — and people are fearful of buying back in — it wouldn’t be surprising to see a short-term reversal in the market. In that regard, taking a long position and aiming to close it in the $8,200 area would make sense as this is the next significant level of resistance.
But if the $7,400 isn’t breached in the next few days, more downwards pressure can be expected to the dismay of the bulls.
The views and opinions expressed here are solely those of the author and do not necessarily reflect the views of CryptoX. Every investment and trading move involves risk. You should conduct your own research when making a decision.


