Ethereum has the potential to extend its ongoing upside move towards or above $1,500.
The second-largest cryptocurrency broke above a consolidation price channel on Wednesday, breaking its upper trendline on surging volumes. So it appears, the channel is an Ascending Triangle that traders perceive as a bullish continuation indicator.
An Ascending Triangle structure develops when an asset fluctuates between a horizontal resistance line to form swing highs and a rising trendline to form swing lows.
Therefore, if the asset trades upward before forming the said structure, its potential for continuing the trend higher increases following a breakout move through the horizontal line; Typically, the breakout target lurks near the level at a distance equal to the length of the previous uptrend move, otherwise known as “Flagpole.”
The Ascending Triangle Setup
Ethereum formed a similar structure following its explosive move from $757 to $1,169. The Triangle pattern established a horizontal resistance line near $1,127. The ETH/USD exchange rate broke the level to the upside during the European session Wednesday, reaching an intraday high of $1,170.
Ethereum enters the resistance range with a history of undergoing sell-offs. Source: ETHUSD on TradingView.com
The price entered the colored region, as shown in the chart above. It held the history of sending ETH/USD lower due to higher selling sentiment. So it appears, traders with a short-term outlook profited from the pair’s intraday top on Wednesday as well. Nevertheless, the price remained above the horizontal line, signaling its potential to extend its breakout move upward.
Ethereum to $1,500
A further break above Ethereum’s session high of $1,168 could prompt traders to eye the Ascending Channel’s breakout target. The flagpole height before the pattern’s formation is around $395. That roughly puts ETH/USD en route to over $1,500.

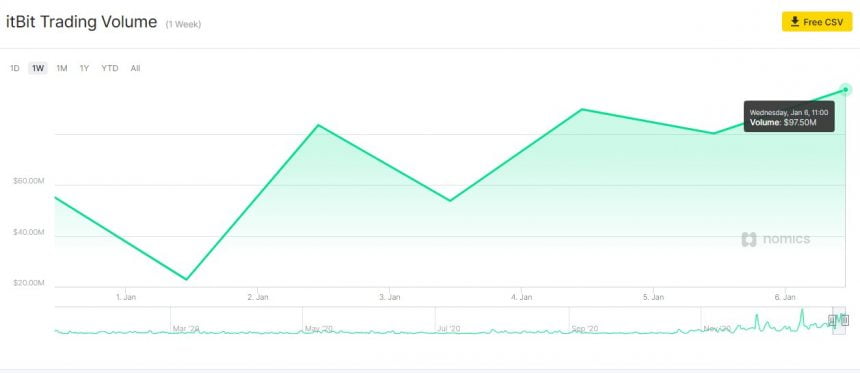
Bitcoin and Ethereum trade volumes near best single-day peaks. Source: itBit
More evidence of a potential Ethereum rally comes from its retail demand. Nugget News Founder Alex Saunders shared a single-day Bitcoin and Ethereum volume chart sourced from itBit, a digital asset platform owned by PayPal’s crypto services provider Paxos. He said:
“Retail demand is absolutely sky rocketing for BTC and ETH with on track to smash their highest single-day volume of $110M. The general public is catching the magic internet money bug, just as a wave of institutional money has begun pouring in.”


