

Bitcoin is facing a strong resistance near the $7,000 level against the US Dollar. BTC price is likely forming a double top pattern near the $7,000 level and it could dive below $6,400.
- Bitcoin is forming a bearish breakdown structure below $7,000 against the US Dollar.
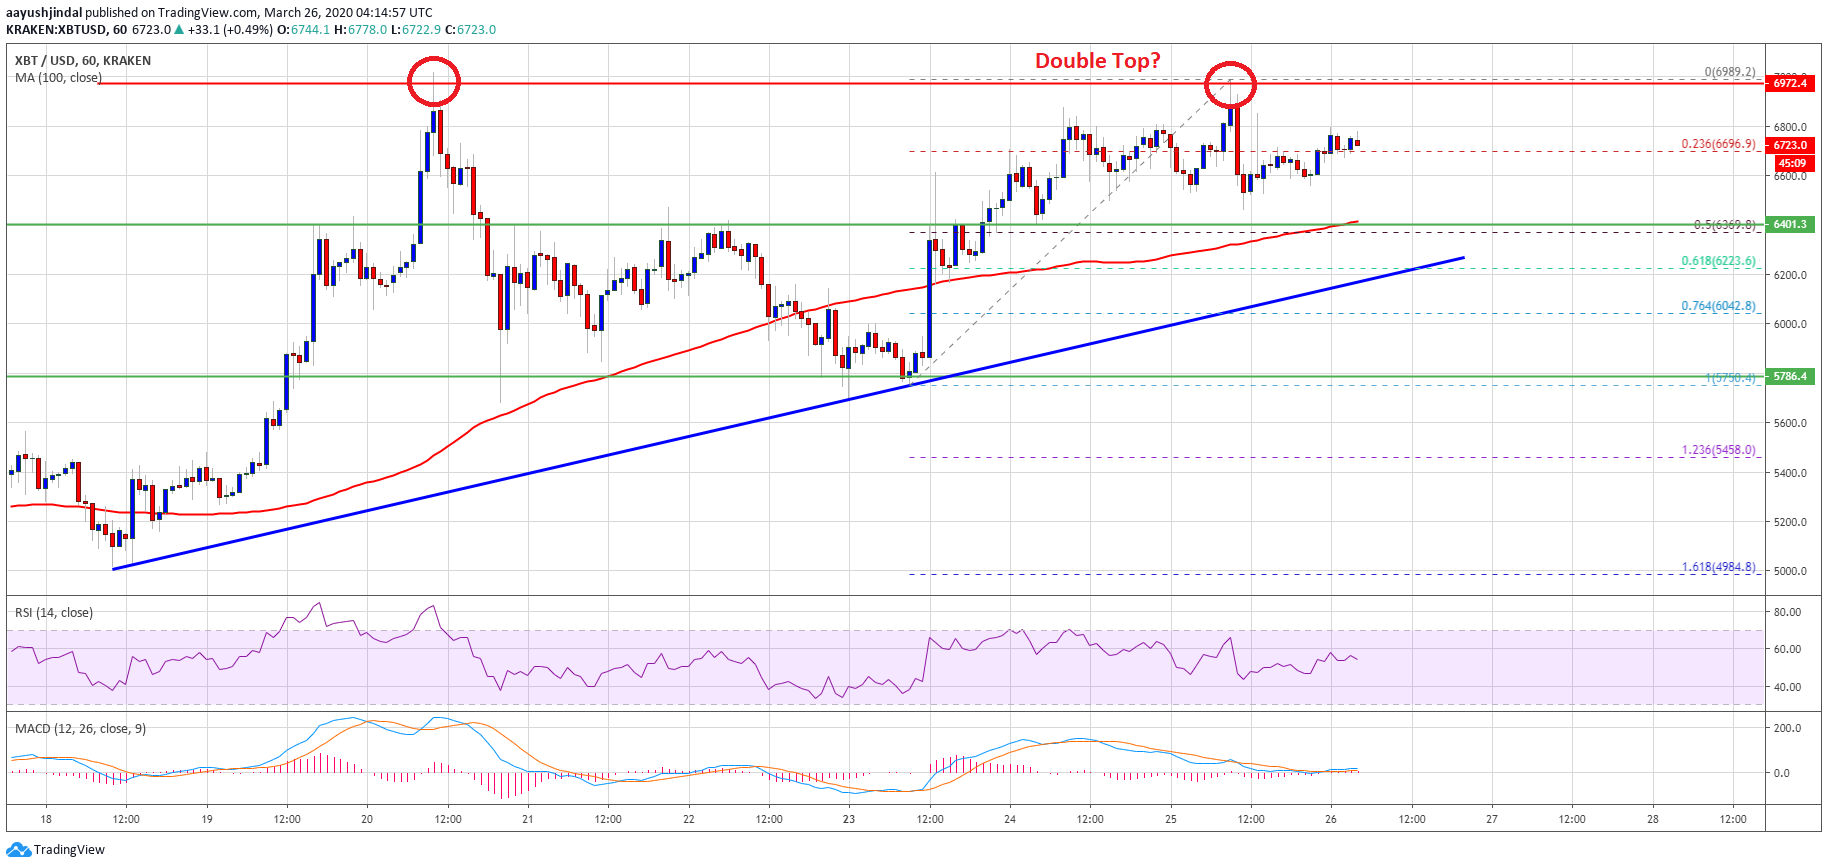
- A double top pattern is forming with resistance near $7,000 and support at $6,400.
- There is a crucial bullish trend line forming with support near $6,240 on the hourly chart of the BTC/USD pair (data feed from Kraken).
- The pair either rally significantly above $7,000 or it might dive towards the $6,000 level.
Bitcoin Facing Hurdles
In the past few sessions, bitcoin remained well bid above the $6,400 support area against the US Dollar. BTC price even climbed above the $6,800 resistance and settled above the 100 hourly simple moving average.
However, the bulls seem to be struggling near the $7,000 resistance area. There is likely a double top pattern forming with resistance near $7,000. The last swing high was formed near $6,989 before the price corrected lower.
There was a break below the 23.6% Fib retracement level of the main rise from the $5,750 swing low to $6,989 high. On the downside, the $6,500 area is acting as a strong support.
The main neckline support for bitcoin is near the $6,400 level and the 100 hourly simple moving average. It is also close to the 50% Fib retracement level of the main rise from the $5,750 swing low to $6,989 high.
If there is a downside break below the $6,400 support and the 100 hourly SMA, it could start a major decline. The next support is near the $6,200 area. Besides, there is a crucial bullish trend line forming with support near $6,240 on the hourly chart of the BTC/USD pair.
A clear break below the trend line support will most likely confirm the highlighted double top pattern. In the stated case, the price is likely to dive towards the $6,000 and $5,800 support levels.
Bearish Invalidation
If bitcoin remains well bid above the $6,500 and $6,400 support levels, it could rise above the $7,000 resistance area in the coming sessions.
A successful break and follow through above $7,000 may perhaps negate the double top pattern and the price could surge towards the $7,500 level.
Technical indicators:
Hourly MACD – The MACD is slowly losing momentum in the bullish zone.
Hourly RSI (Relative Strength Index) – The RSI for BTC/USD is currently above the 50 level, with a bearish angle.
Major Support Levels – $6,500 followed by $6,400.
Major Resistance Levels – $6,900, $7,000 and $7,200.


