
Bitcoin’s ongoing low-volatility range play is reminiscent of the price doldrums observed ahead of a sudden 40% price crash in the second half of November 2018.
This time, however, the price squeeze may end with a bullish move, on-chain metrics and macro factors suggest.
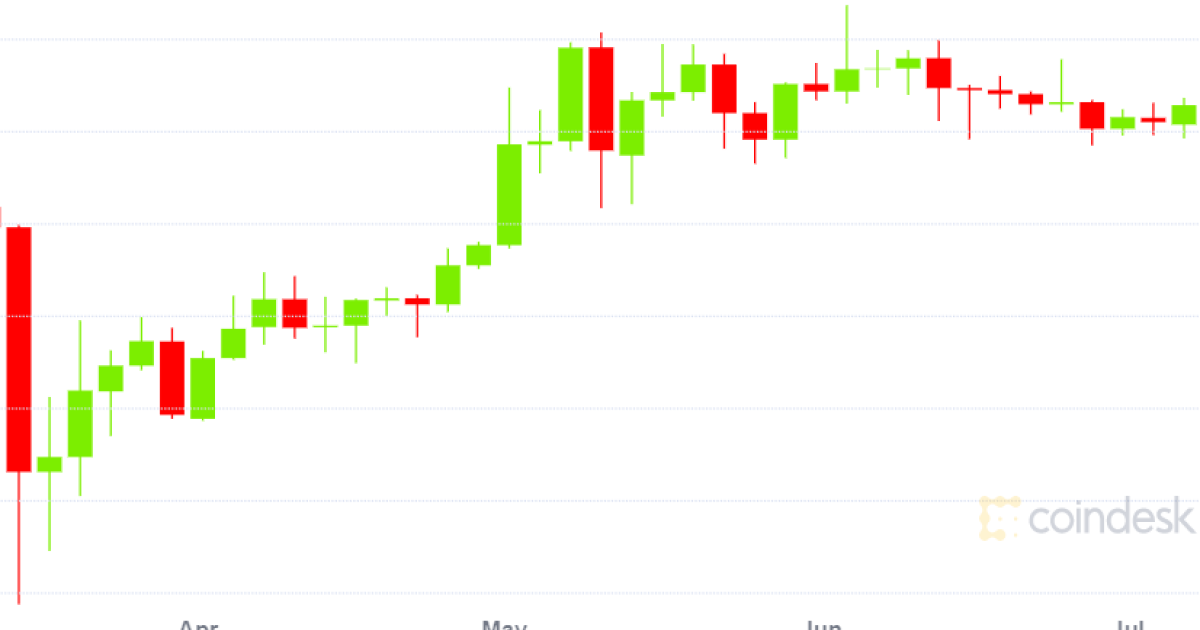
The leading cryptocurrency by market value has spent a better part of the last three months trading the range of $9,000–$10,000. While sellers pushed prices below $9,000 on a few occasions, they failed to establish a foothold.
As a result, the Bollinger bandwidth, a price volatility gauge, has declined to 0.04, the lowest level since Nov. 12, 2018, according to data source TradingView.
Bollinger bands are placed two standard deviations above and below the 20-day moving average (MA) of price. Meanwhile, the Bollinger bandwidth is calculated by dividing the spread between the volatility bands by the 20-day MA.
Volatility, as represented by Bollinger bandwidth, topped out at 0.89 following the March 12 crash, dubbed Black Thursday, and has been on a declining trend ever since.
A similar pattern was observed in 2018 (above right), when the bandwidth fell from 0.5 to 0.04 in the two months to Nov. 12. The cryptocurrency had been locked in the narrow range of $6,000–$6,800.
A prolonged period of low volatility consolidation often ends with a violent move in either direction. That’s what happened in 2018, two days after the bandwidth slipped to 0.04. The cryptocurrency dived below $6,000 on Nov. 14 – two days after the bandwidth hit a low of 0.04 – then went on to hit lows below $3,500 by Nov. 25. The fall marked a 41% drop over two weeks.
Back then, though, the broader market structure was bearish. The cryptocurrency had charted lower highs in the first half of the year, having topped out at $20,000 in December 2017.
The latest consolidation, on the other hand, was preceded by a bullish structure. The cryptocurrency bottomed out at $3,867 in mid-March and has charted multiple higher lows over the past four months.
In addition, on-chain data shows holding sentiment is quite strong at the moment. For instance, over 62% of BTC haven’t moved in over a year, according to Glassnode, a blockchain analytics firm.
Meanwhile, the unprecedented monetary and fiscal stimulus launched by the global authorities to counter the coronavirus-induced economic slowdown is widely expected to boost demand for bitcoin, often touted as digital gold and a hedge against inflation. As such, the ongoing consolidation may end soon with a strong move to the higher side.
Also read: CORRELATION: Crypto’s Most Enigmatic Metric
However, if the global stock markets begin to slide on renewed coronavirus concerns and China-U.S. tensions, bitcoin could instead witness a big move to the downside. The cryptocurrency has recently developed a record positive correlation with the S&P 500, Wall Street’s benchmark equity index.
Disclosure: The author holds no cryptocurrency assets at the time of writing.
The leader in blockchain news, CryptoX is a media outlet that strives for the highest journalistic standards and abides by a strict set of editorial policies. CryptoX is an independent operating subsidiary of Digital Currency Group, which invests in cryptocurrencies and blockchain startups.


