The Bitcoin leverage ratio is showing a sell signal right now, indicating that the market could turn bearish, at least in the short term.
Bitcoin Leverage Ratio Says Not A Good Time To Buy Right Now
As pointed out by a CryptoQuant post, the estimated leverage ratio indicates that this might not be the best time to buy BTC.
The all exchanges estimated Bitcoin leverage ratio is an indicator that’s calculated by taking the ratio of open interest divided by the reserves of all exchanges.
Estimated Leverage Ratio = Open Interest ÷ Amount of Reserve
For those unfamiliar with futures trading, the “open interest” refers to the total number of contracts held by users at the end of a trading day. The all exchanges reserve is naturally the total amount of Bitcoin held in wallets of all exchanges.
The leverage ratio indicator can show how much leverage is used by a trader on average. When the value of the metric goes up, it means traders are becoming increasingly confident in their positions.
Related Reading | New To Bitcoin? Learn To Trade Crypto With The NewsBTC Trading Course
Similarly, a downtrend in the value of the indicator implies the opposite. With the help of these trends, it becomes possible to know whether traders are taking a high risk or a low risk.
Now, here is how the latest chart for the Bitcoin leverage ratio looks like:
The BTC leverage ratio slightly moves up | Source: CryptoQuant
As the above graph shows, the movement of the indicator can be used to tell where the BTC price might head next.
Related Reading | As Crypto Market Goes Into “Extreme Greed,” Is Bitcoin Set For New All-Time High?
The leverage ratio moving down usually signals a good buying spot, while its value going up has suggested otherwise throughout the year.
Presently, the metric’s value is moving upwards, meaning it’s not a good time to buy more Bitcoin, and the coin could be observing a short-term correction soon.
BTC Price
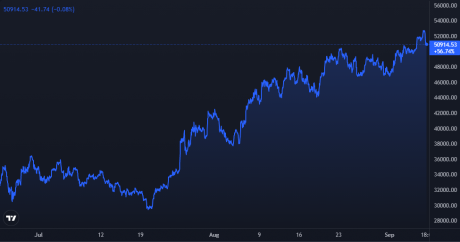
At the time of writing, Bitcoin’s price is around $50.9k, up 6% in the last 7 days. Over the past month, the crypto has gained 13% in value.
The below chart shows the trends in the price of the coin over the last three months:
Bitcoin plunges down | Source: BTCUSD on TradingView
After struggling just below the $50k price range for a while, BTC seems to have finally gained some solid ground above the mark.
Yesterday, Bitcoin almost reached $53k in a sharp move up, but has since fallen off drastically as the price now floats below $51k.
If the leverage ratio is anything to go by, BTC could turn bearish and see some downtrend trend soon. However, it’s likely to be only a short-term correction as other indicators still show that the crypto is bullish in the long term.


