

Bitcoin price failed to clear the key $36,000 resistance zone against the US Dollar. BTC is showing a few bearish signs and it could continue lower towards $30,000.
- Bitcoin failed to gain momentum above the 36,000 and $36,200 resistance levels.
- The price is now struggling below $35,000 and the 100 hourly simple moving average.
- There is a major bearish trend line forming with resistance near $34,600 on the hourly chart of the BTC/USD pair (data feed from Kraken).
- The pair could continue to move down towards $30,000 as long as it is below $35,000.
Bitcoin Price is Showing Bearish Signs
After trading as low as $30,312, bitcoin price started a fresh increase. BTC surpassed the $32,000 and $34,000 resistance levels to move into a positive zone.
The price even spiked above the $36,000 resistance. However, there was no close above $36,200 and $36,500 (a major hurdle as discussed yesterday). As a result, there was a rejection near $36,500 and the price declined below the $35,000 level.
There was a break below the $34,000 level and the 100 hourly simple moving average. The price even broke the 50% Fib retracement level of the upward move from the $30,312 low to $36,617 high.
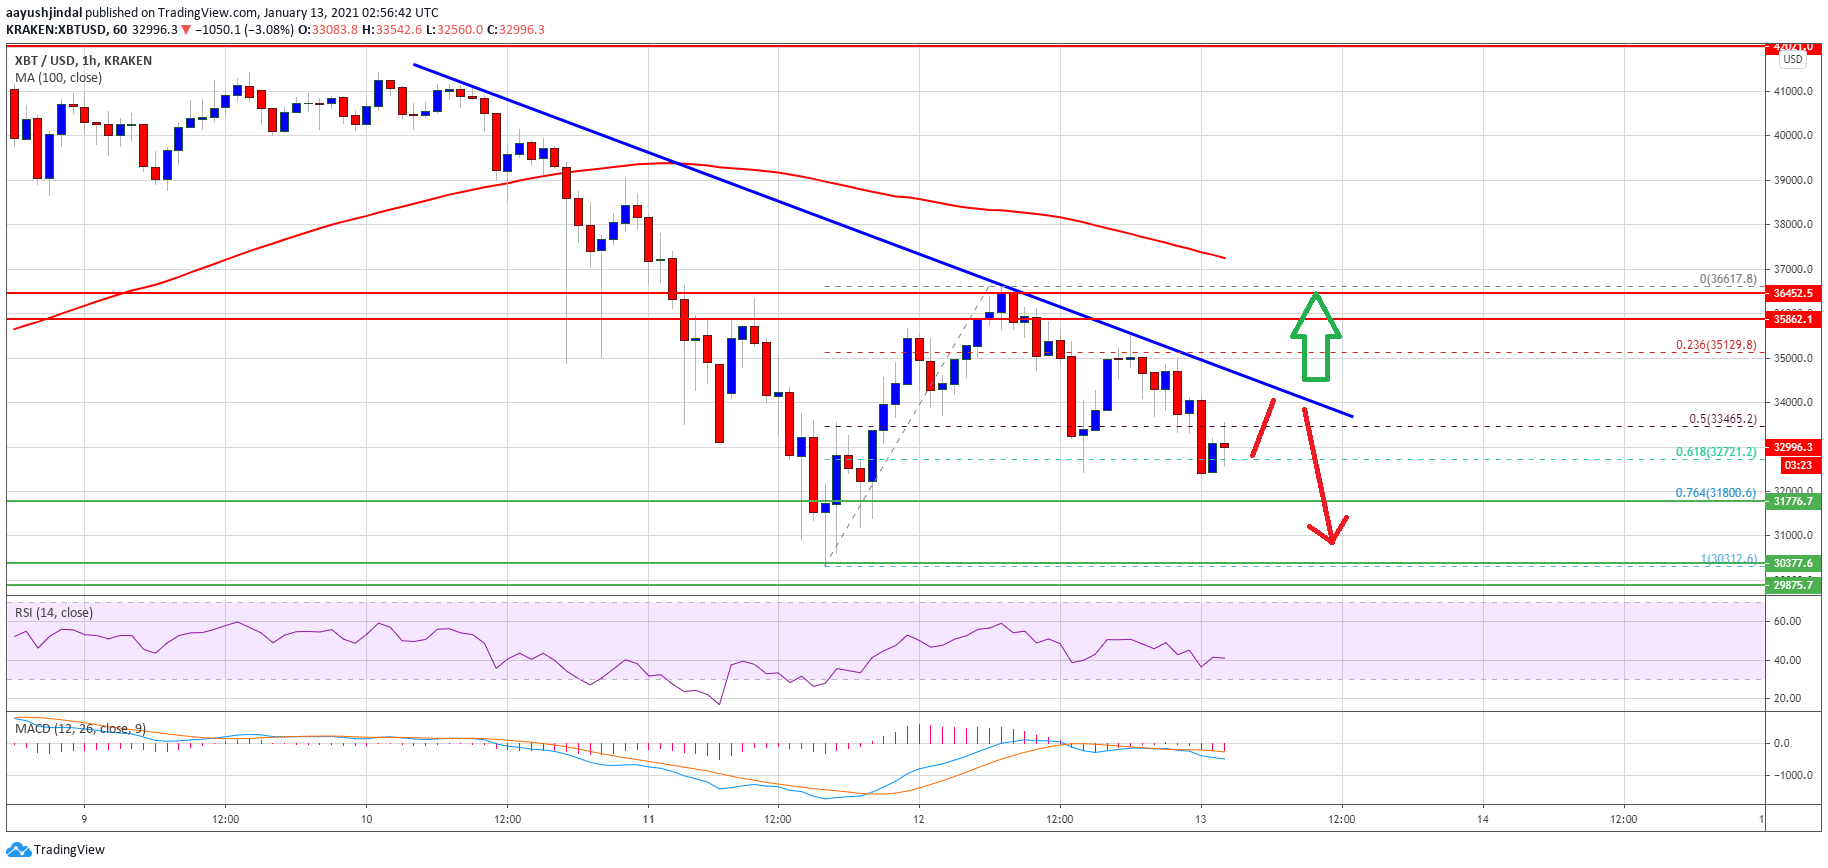
Source: BTCUSD on TradingView.com
There is also a major bearish trend line forming with resistance near $34,600 on the hourly chart of the BTC/USD pair. An initial support on the downside is near the $32,700 level. It is close to the 61.8% Fib retracement level of the upward move from the $30,312 low to $36,617 high.
The next major support is near the $31,700 level, below which bitcoin price might continue to move down towards the $30,500 and $30,000 levels. Any more losses could lead the price towards the $28,000 support zone.
Fresh Increase in BTC?
To move into a positive zone, bitcoin price needs to clear many hurdles, starting with $34,600. The first major resistance for the bulls is near the $35,000 level.
The main resistance is still near the $36,000, $36,200 and $36,500 levels. A close above $36,500 is likely to start a fresh rally towards $39,200 and $40,000 in the near term.
Technical indicators:
Hourly MACD – The MACD is slowly gaining momentum in the bearish zone.
Hourly RSI (Relative Strength Index) – The RSI for BTC/USD is recovering, but it is still below the 50 level.
Major Support Levels – $32,700, followed by $31,700.
Major Resistance Levels – $35,000, $36,000 and $36,500.


