

Bitcoin is trading above the $9,600 and $9,500 levels against the US Dollar. BTC price is showing positive signs and it seems a few steps away from smashing the $10,000 resistance.
- Bitcoin is trading nicely above the $9,600 and $9,560 support levels.
- The price is likely to make another attempt to clear the $9,950 and $10,000 resistance levels.
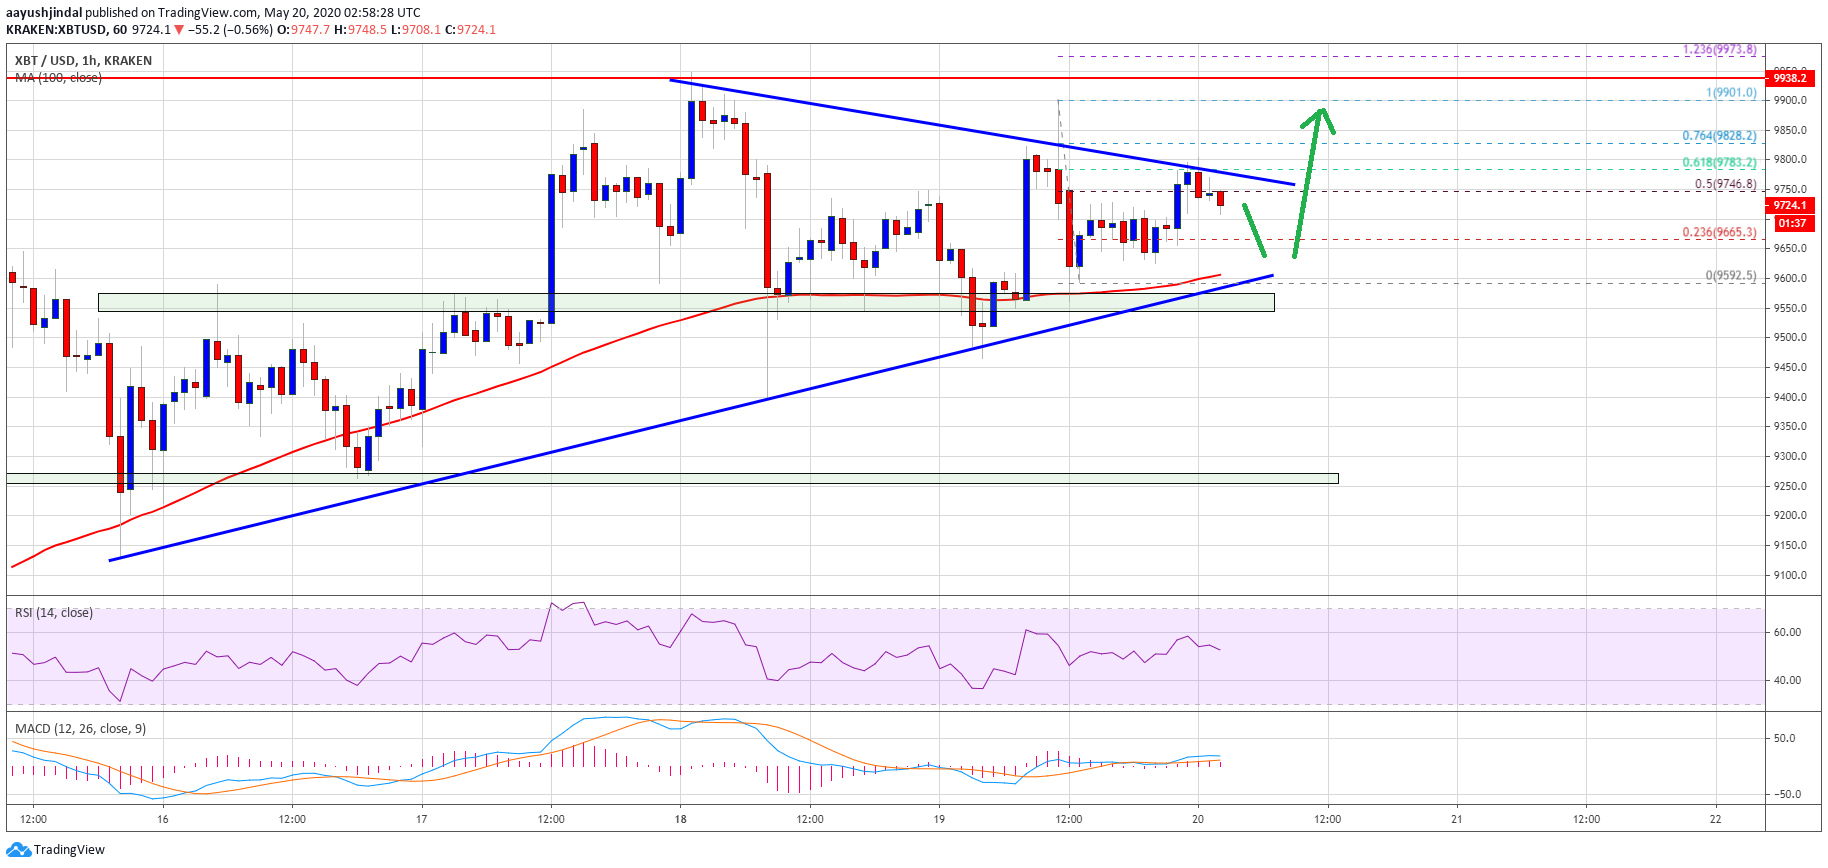
- There is a crucial bullish trend line forming with support near $9,590 on the hourly chart of the BTC/USD pair (data feed from Kraken).
- The pair could either rally significantly above $10,000 or start a major slide below the $9,560 support.
Bitcoin Approaching Key Breakout
Bitcoin price is trading above a few important supports near the $9,560 and $9,500 levels against the US Dollar. BTC price seems to be trading inside a contracting range and it recently tested the $9,900 zone.
A high was formed near $9,901 before the price corrected lower. It traded below the $9,700, but the $9,600 area acted as support. A low is formed near $9,592 and the price is currently rising.
There was a break above the $9,650 and $9,700 levels. Bitcoin price traded above the 50% Fib retracement level of the recent decline from the $9,901 high to $9,592 low. On the upside, an initial hurdle is near the $9,780 level and a connecting bearish trend line on the hourly chart of the BTC/USD pair.
The 61.8% Fib retracement level of the recent decline from the $9,901 high to $9,592 low is also near $9,780. If there is a clear break above the trend line resistance and $9,800, the price could revisit the $9,950 and $10,000 resistance levels.
To start a significant upward move, the price must break the $9,950 and $10,000 resistance levels. If the bulls succeed, the next key resistance could be $10,500, above which the price might test $11,200.
Downside Reaction?
If bitcoin continue higher and struggles to clear the $9,950 and $10,000 resistance levels, there is a risk of a bearish reaction in the coming sessions.
On the downside, there is a crucial bullish trend line forming with support near $9,590 on the same chart. The main support is near the $9,560 level, below which the price might dive towards the $9,200 and $9,000 levels in the near term.
Technical indicators:
Hourly MACD – The MACD is about to move into the bullish zone.
Hourly RSI (Relative Strength Index) – The RSI for BTC/USD is now well above the 50 level.
Major Support Levels – $9,590 followed by $9,560.
Major Resistance Levels – $9,800, $9,950 and $10,000.


