Bitcoin is risking massive price declines below $9,000 as a historically accurate fractal indicates traders’ sell-off sentiment.
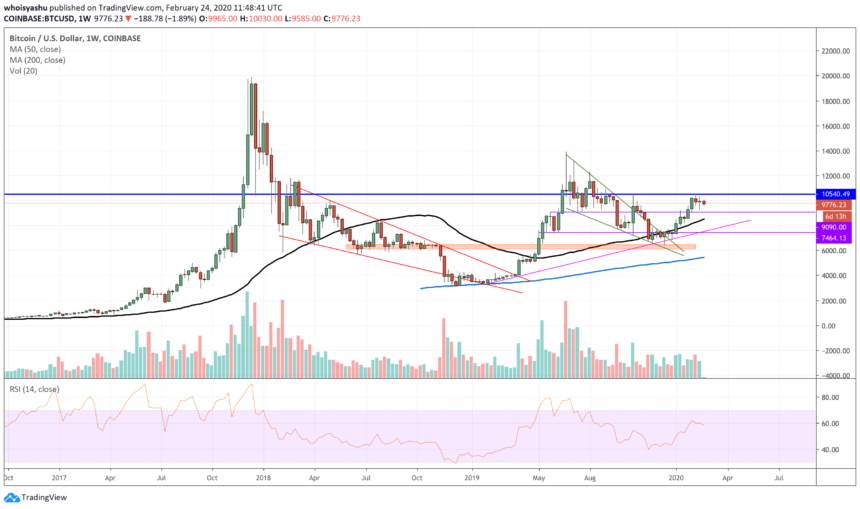
The benchmark cryptocurrency’s tendency to retest the $8,750 level increased after it confirmed a bullish reversal pattern last week. Dubbed as Doji, the indicator is typically a session wherein an asset’s candlestick has almost the same opening and closing rate. Technical analysts treat it as a sign of trend reversal.
Bitcoin’s last week’s performance saw it open the market at $9,920 and close it near $9,965, according to data fetched by Coinbase exchange. Meanwhile, the cryptocurrency began in a negative area heading into the new week today. The entire price action appeared as a reminiscent of a similar move back in May 2019.
Prominent market analyst KongBTC noted that bitcoin’s formation of a weekly Doji candle in May 2019 resulted in a massive price decline. The full-time trader expected traders to undergo a similar sell-off sentiment as bitcoin continues to remain capped under a strict resistance area of $10,000-10,500.
“Last time [Doji] was followed by a 12.3% dump,” wrote KongBTC. “This time a 12.3% dump would bring us to a weekly key-level at $8,750.”
Weak Hands
The technical downside target looked achievable also because of a lack of bullish strength above the $10,000-level.
Traders in the past two weeks looked too afraid to enter new long positions above the said resistance. Also, the area above the five-figure valuation saw weaker trading volumes and momentum, confirming the likelihood of bitcoin registering new short-term lows.
Investment guru DonAlt said earlier today that bitcoin would likely remain under the $10,000-resistance, which means a run below $9,000 is most likely to happen sooner or later.
“Still looking good for bears in my opinion,” said DonAlt. “Given that I’m trading counter-trend, I moved my stop another step down just above $10,000. If I’m correct we won’t see $10000 again for quite a while.”
$BTC update:
Still looking good for bears in my opinion.
Given that I’m trading counter-trend, I moved my stop another step down just above $10000.
If I’m correct we won’t see $10000 again for quite a while.
If I’m wrong, I’ll walk away with 2 weeks of funding + a couple % move. pic.twitter.com/j9BRr9TRrO— DonAlt (@CryptoDonAlt) February 24, 2020
Bitcoin Bulls Still in Charge
While Doji does sound like an alarm of a diving bitcoin price, combining it with other vital patterns shows a slightly bullish picture.
Bitcoin’s Relative Strength Index (RSI), for instance, indicate that the cryptocurrency is still underbought. Meanwhile, bitcoin has broken above a crucial resistance area defined by its 50-weekly moving average. Therefore, the cryptocurrency still has room to continue the bull run that has already swelled by more than 32 percent so far into 2020.
That said, the current Doji formation could also be a ‘Spinning Top,’ – a candlestick pattern that signals weakness in the current trend but not reversal. Overall, it means that traders might be in a standoff so they could be gaining momentum to continue the uptrend.


