

Bitcoin started an upside correction from the $17,600 zone against the US Dollar. BTC is now facing a strong resistance near $20,500 and $21,000.
- Bitcoin was able to recover losses from the $17,600 support zone.
- The price is now still below the $20,000 level and the 100 hourly simple moving average.
- There was a break above a key bearish trend line with resistance near $19,200 on the hourly chart of the BTC/USD pair (data feed from Kraken).
- The pair remains at a risk of a fresh decline unless it settles above the $21,000 resistance zone.
Bitcoin Price Eyes Steady Recovery
Bitcoin price followed a bearish path and declined sharply below the $20,000 support zone. It declined over 10% and even spiked below the $18,000 level.
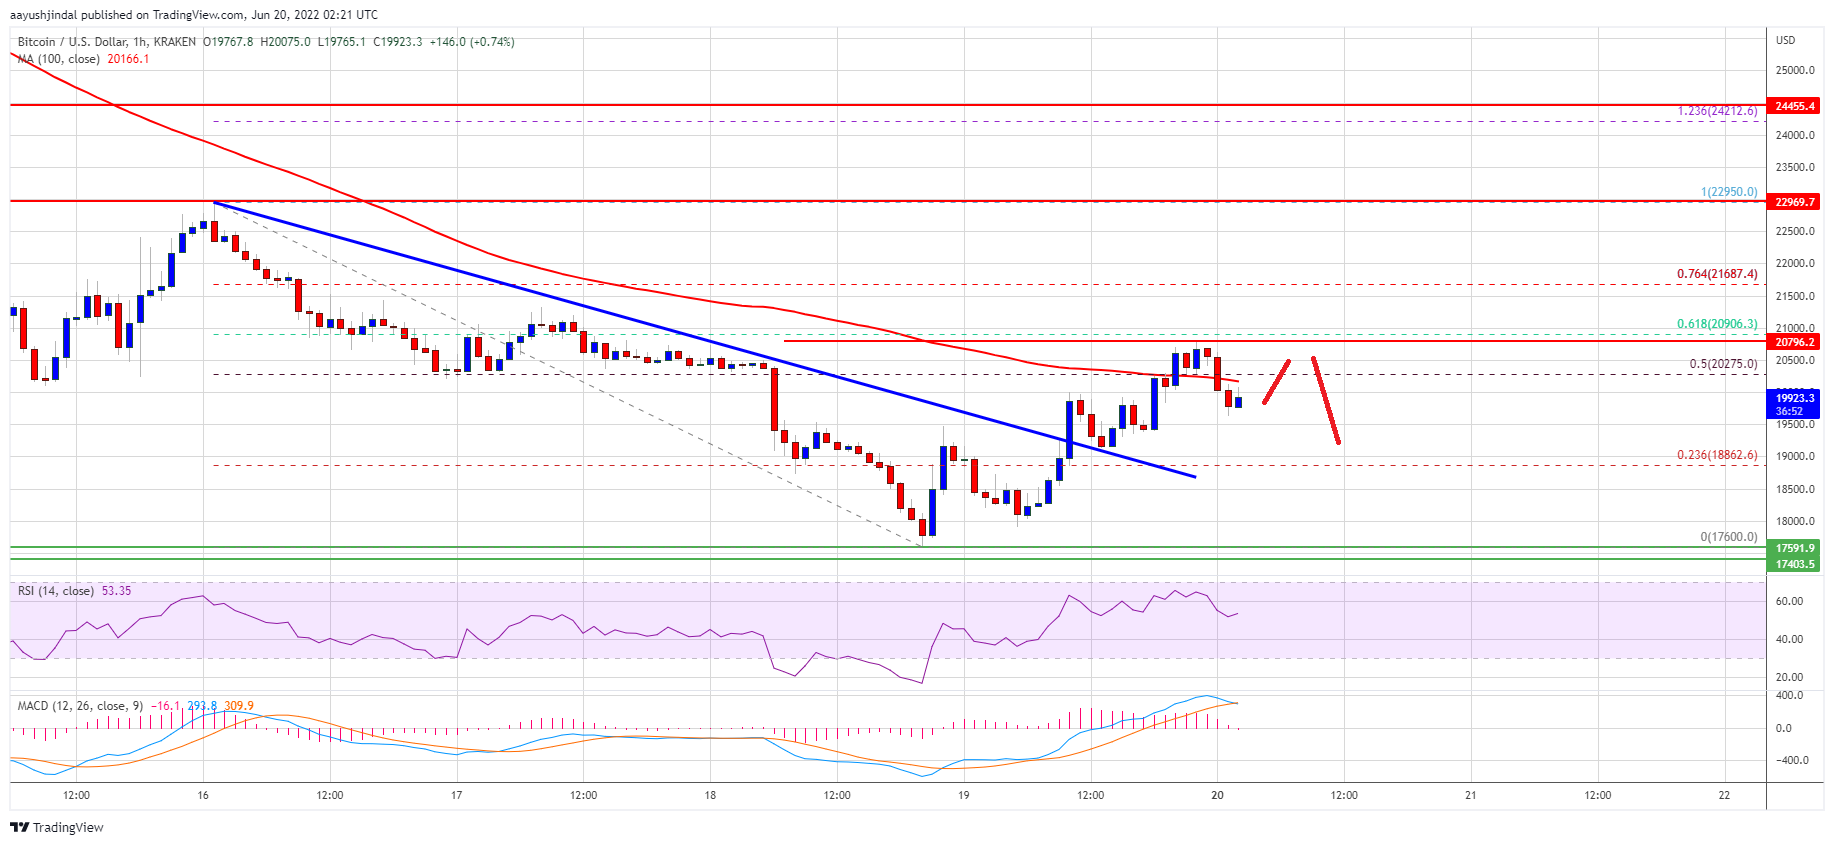
A low was formed near $17,600 before the price started an upside correction. There was a recovery wave above the $18,000 and $18,500 resistance levels. Besides, there was a break above a key bearish trend line with resistance near $19,200 on the hourly chart of the BTC/USD pair.
Bitcoin climbed above the 50% Fib retracement level of the key decline from the $22,950 high to $17,600 low. The price even spiked above the $20,000 level and the 100 hourly simple moving average.
However, the bears were active near the $20,500 and $20,750 levels. The 61.8% Fib retracement level of the key decline from the $22,950 high to $17,600 low also acted as a resistance. The price is now trading below the $20,000 level and the 100 hourly simple moving average.
Source: BTCUSD on TradingView.com
An immediate resistance on the upside is near the $20,200 level. The first major resistance is near the $20,500 level. Any more gains might send the price towards the $21,000 level. A close above the $21,000 level could set the pace for a larger increase.
Fresh Decline in BTC?
If bitcoin fails to clear the $20,500 resistance zone, it could start a fresh decline. An immediate support on the downside is near the $19,500 level.
The next major support is near the $18,800 level. A downside break below the $18,800 support could spark a sharp decline. In the stated case, the price could test $17,600.
Technical indicators:
Hourly MACD – The MACD is now losing pace in the bullish zone.
Hourly RSI (Relative Strength Index) – The RSI for BTC/USD is now just above the 50 level.
Major Support Levels – $19,500, followed by $18,800.
Major Resistance Levels – $20,200, $20,500 and $21,000.


 Supports the Kuwait Digital Transformation Conference on Driving the Nation towards Digitization in Line with Kuwait’s Vision 2035")