
Bitcoin has been trending up since hitting a local low below $25,000 on September 11th. Yesterday’s rally to $27,435 marked a 10% increase from the recent low. As NewsBTC reported, the rally was largely led by the futures market and a massive increase in open interest of over $1 billion, more than half of which was flushed out when BTC fell back below $27,000. Despite this, BTC is up around 7.5% from last week’s low. A reason to be bullish?
Glassnode Report Sheds Light On Market Sentiment
According to Glassnode, the Realized HODL Ratio (RHODL) serves as a crucial market sentiment indicator. It measures the balance between investments in recently moved coins (those held for less than a week) and those in the hands of longer-term HODLers (held for 1-2 years). The RHODL Ratio for the year 2023 is flirting with the 2-year median level. While this indicates a modest influx of new investors, the momentum behind this shift remains relatively weak.
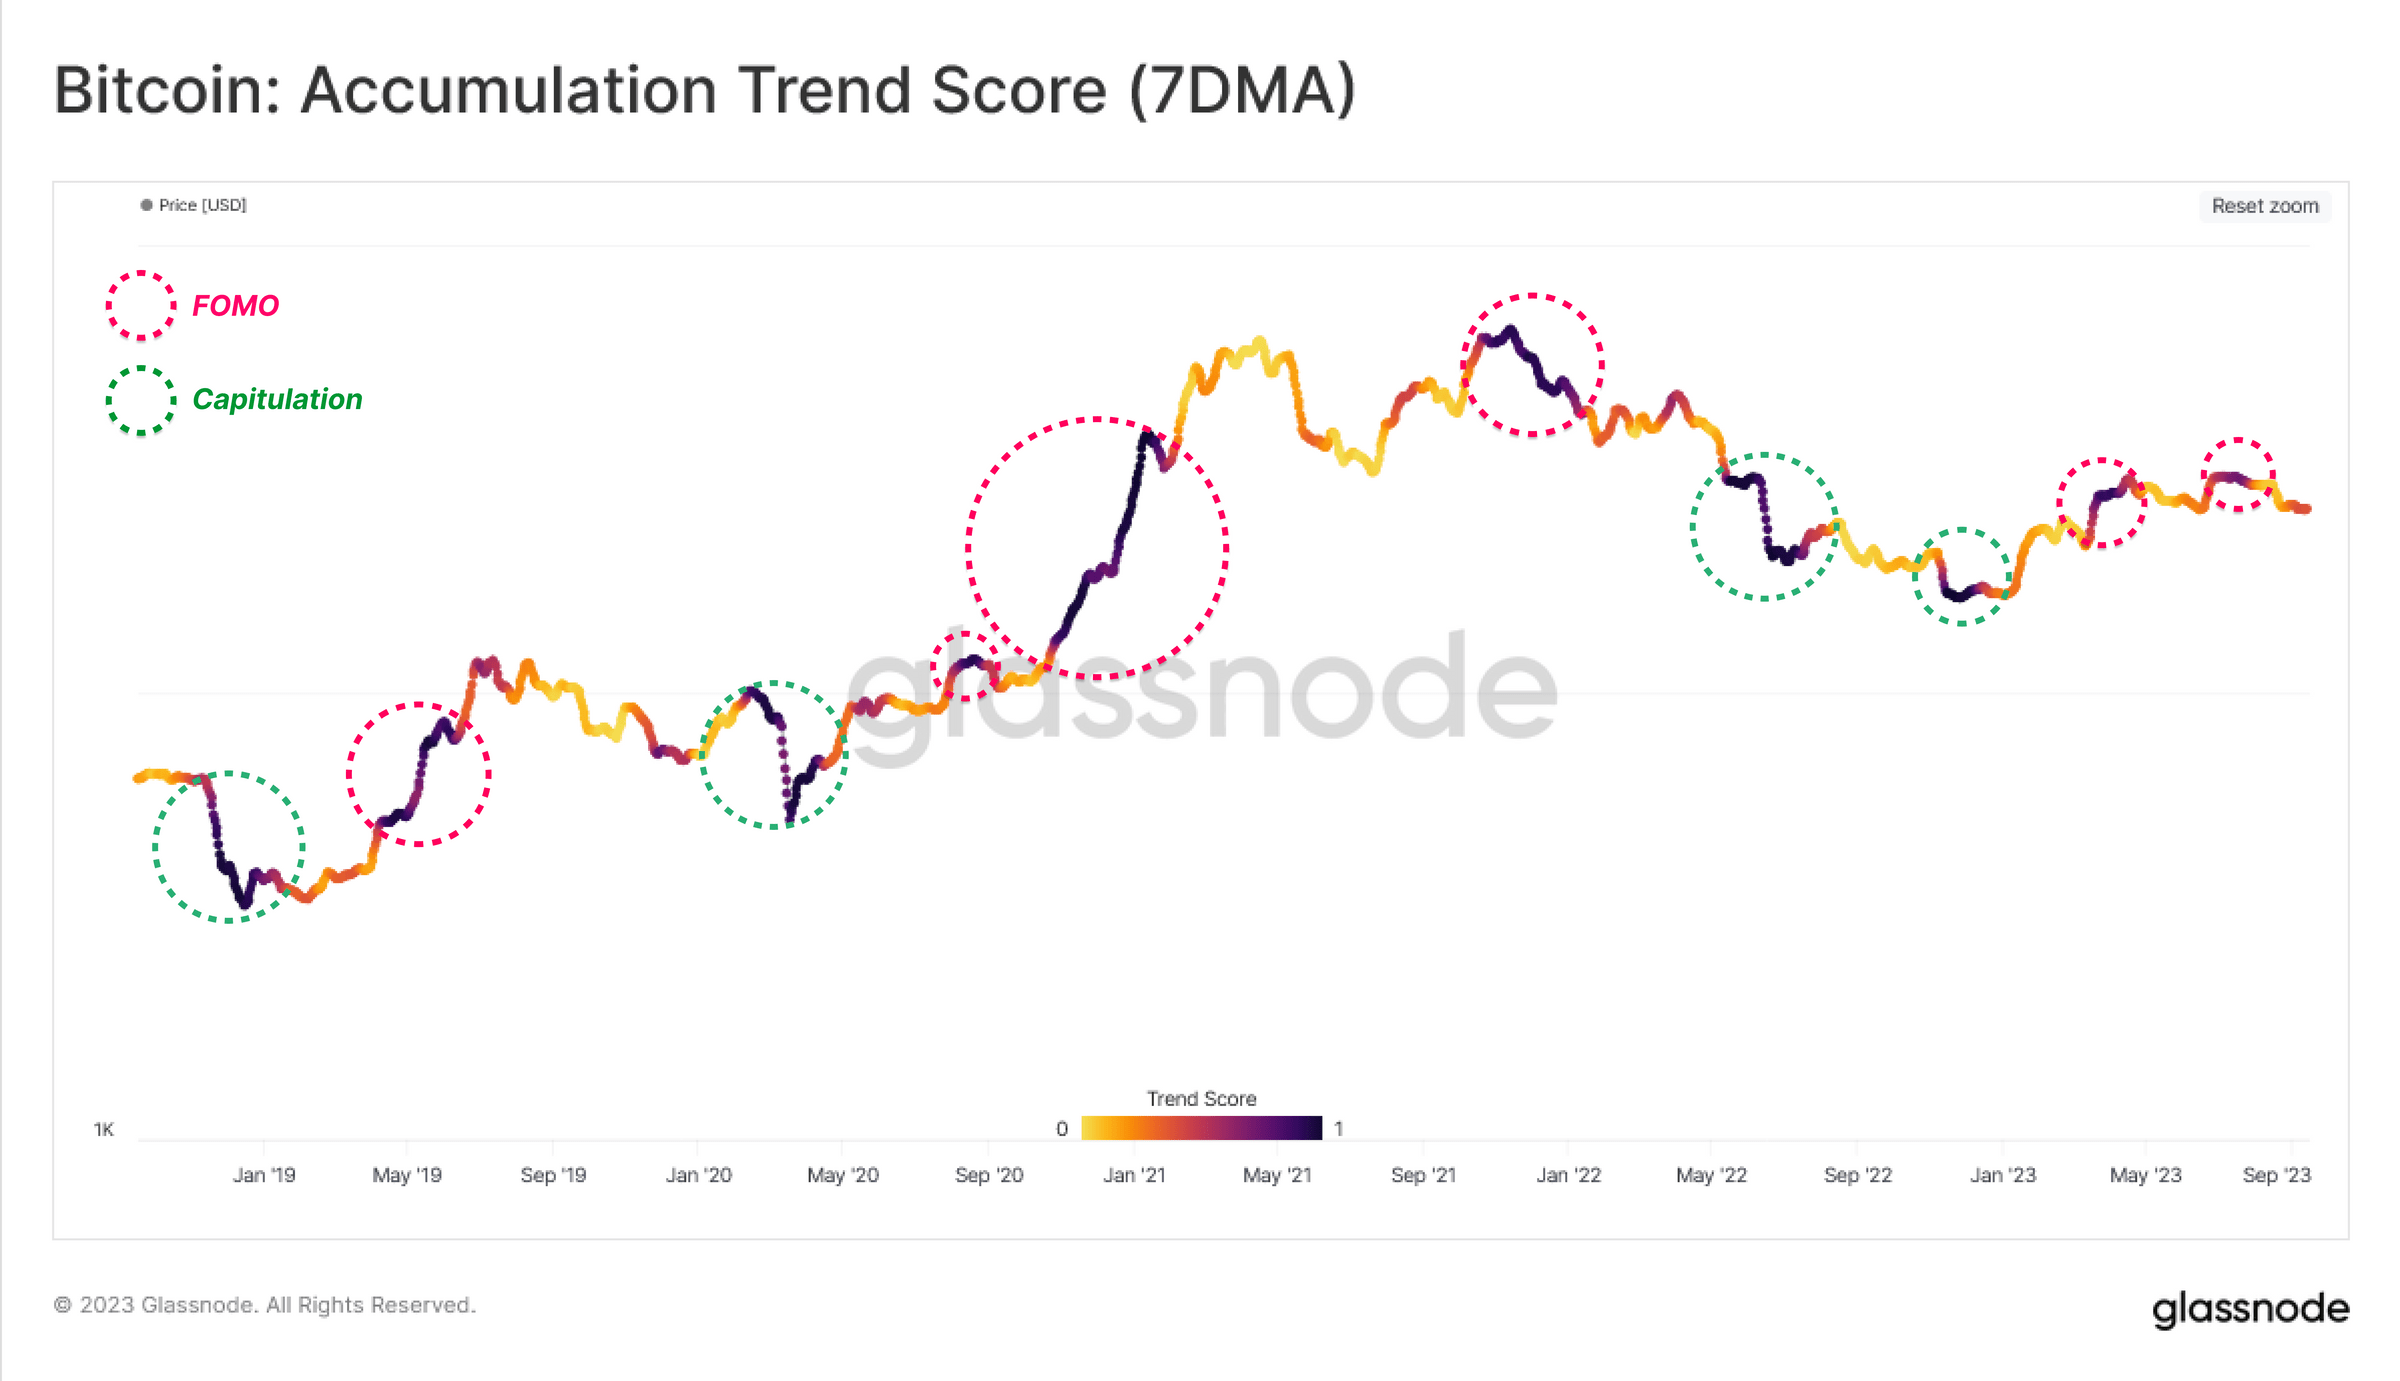
Glassnode’s Accumulation Trend Score further elaborates on this trend. It shows that the current recovery rally of 2023 has been significantly influenced by investor FOMO (Fear of Missing Out), with noticeable accumulation patterns around local price tops exceeding $30,000. This behavior contrasts sharply with the latter half of 2022, where newer market entrants showed resilience by accumulating Bitcoin at lower price levels.
The Realized Profit and Loss indicators also reveal a complex picture. These metrics measure the value change of spent coins by comparing the acquisition price with the disposal price. In 2023, periods of intense coin accumulation were often accompanied by elevated levels of profit-taking. This pattern, which Glassnode describes as a “confluence,” is similar to market behavior seen in peak periods of 2021.
An assessment of Short-Term Holders (STH) uncovers a precarious situation. A staggering majority, more than 97.5% of the supply procured by these newcomers, is currently operating at a loss, levels unseen since the infamous FTX debacle. Using the STH-MVRV and STH-SOPR metrics, which quantify the magnitude of unrealized and realized profits or losses, Glassnode elucidates the extreme financial pressures recent investors have grappled with.
Market Confidence Remains Low
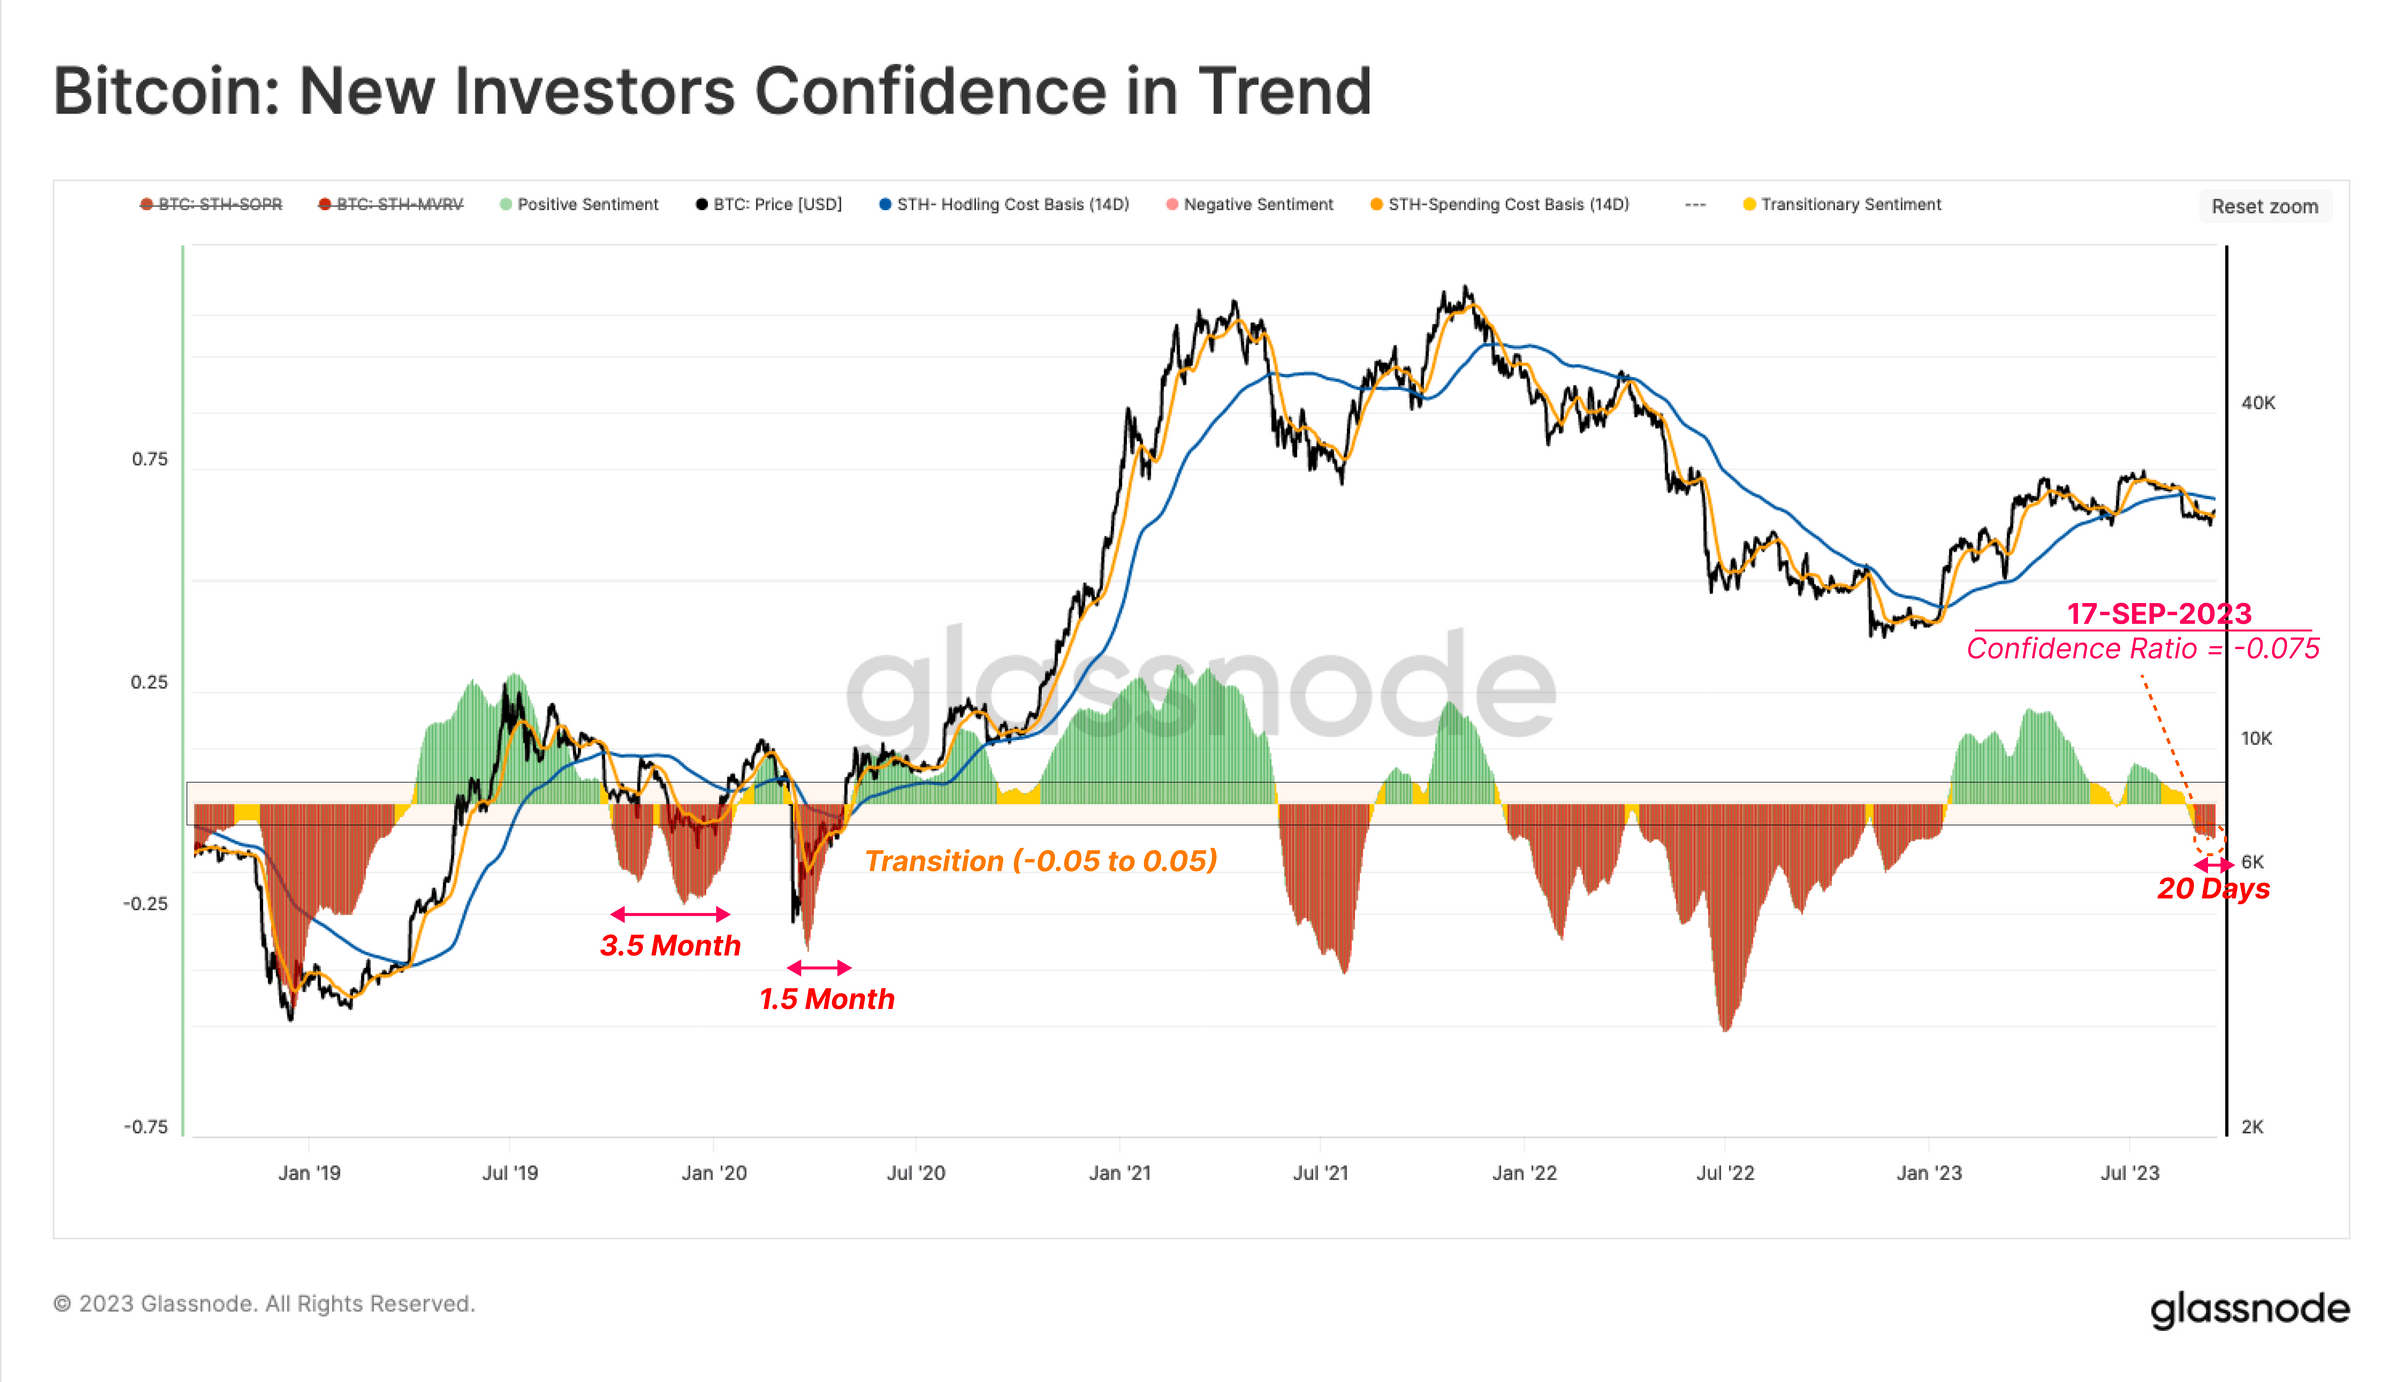
The report also delves into the realm of market confidence. A close examination of the divergence between the cost basis of two investor subgroups — spenders and holders — offers an indication of prevailing market sentiment. As the market reeled from the price plummet from $29k to $26k in mid-August, an overwhelmingly negative sentiment was evident. This was manifested as the cost basis of spenders fell sharply below that of holders, a clear signal of prevalent market panic.
To offer a clearer visualization, Glassnode has normalized this metric in relation to the spot price. A crucial observation is the cyclical nature of negative sentiment during bear market recovery phases, usually lasting between 1.5 to 3.5 months. The market recently plunged into its first negative sentiment phase since 2022’s conclusion.
Currently, the trend lasts 20 days, which could mean that the end has not yet been marked by the recent rally, if history repeats itself. However, if there is a sustained bounce back into positive territory, it could be indicative of renewed capital inflow, signifying a return to a more favorable stance for Bitcoin holders.
In conclusion, Glassnode’s on-chain data reveals a Bitcoin market that is currently in a state of flux. Although 2023 has seen new capital entering the market, the influx lacks strong momentum. Market sentiment, especially among short-term holders, is decidedly bearish. These findings indicate that caution remains the watchword, with underlying market sentiment offering mixed signals about the sustainability of the current Bitcoin rally.
At press time, BTC traded at $26,846 after being rejected at the 23.6% Fibonacci retracement level (at $27,369) in the 4-hour chart.
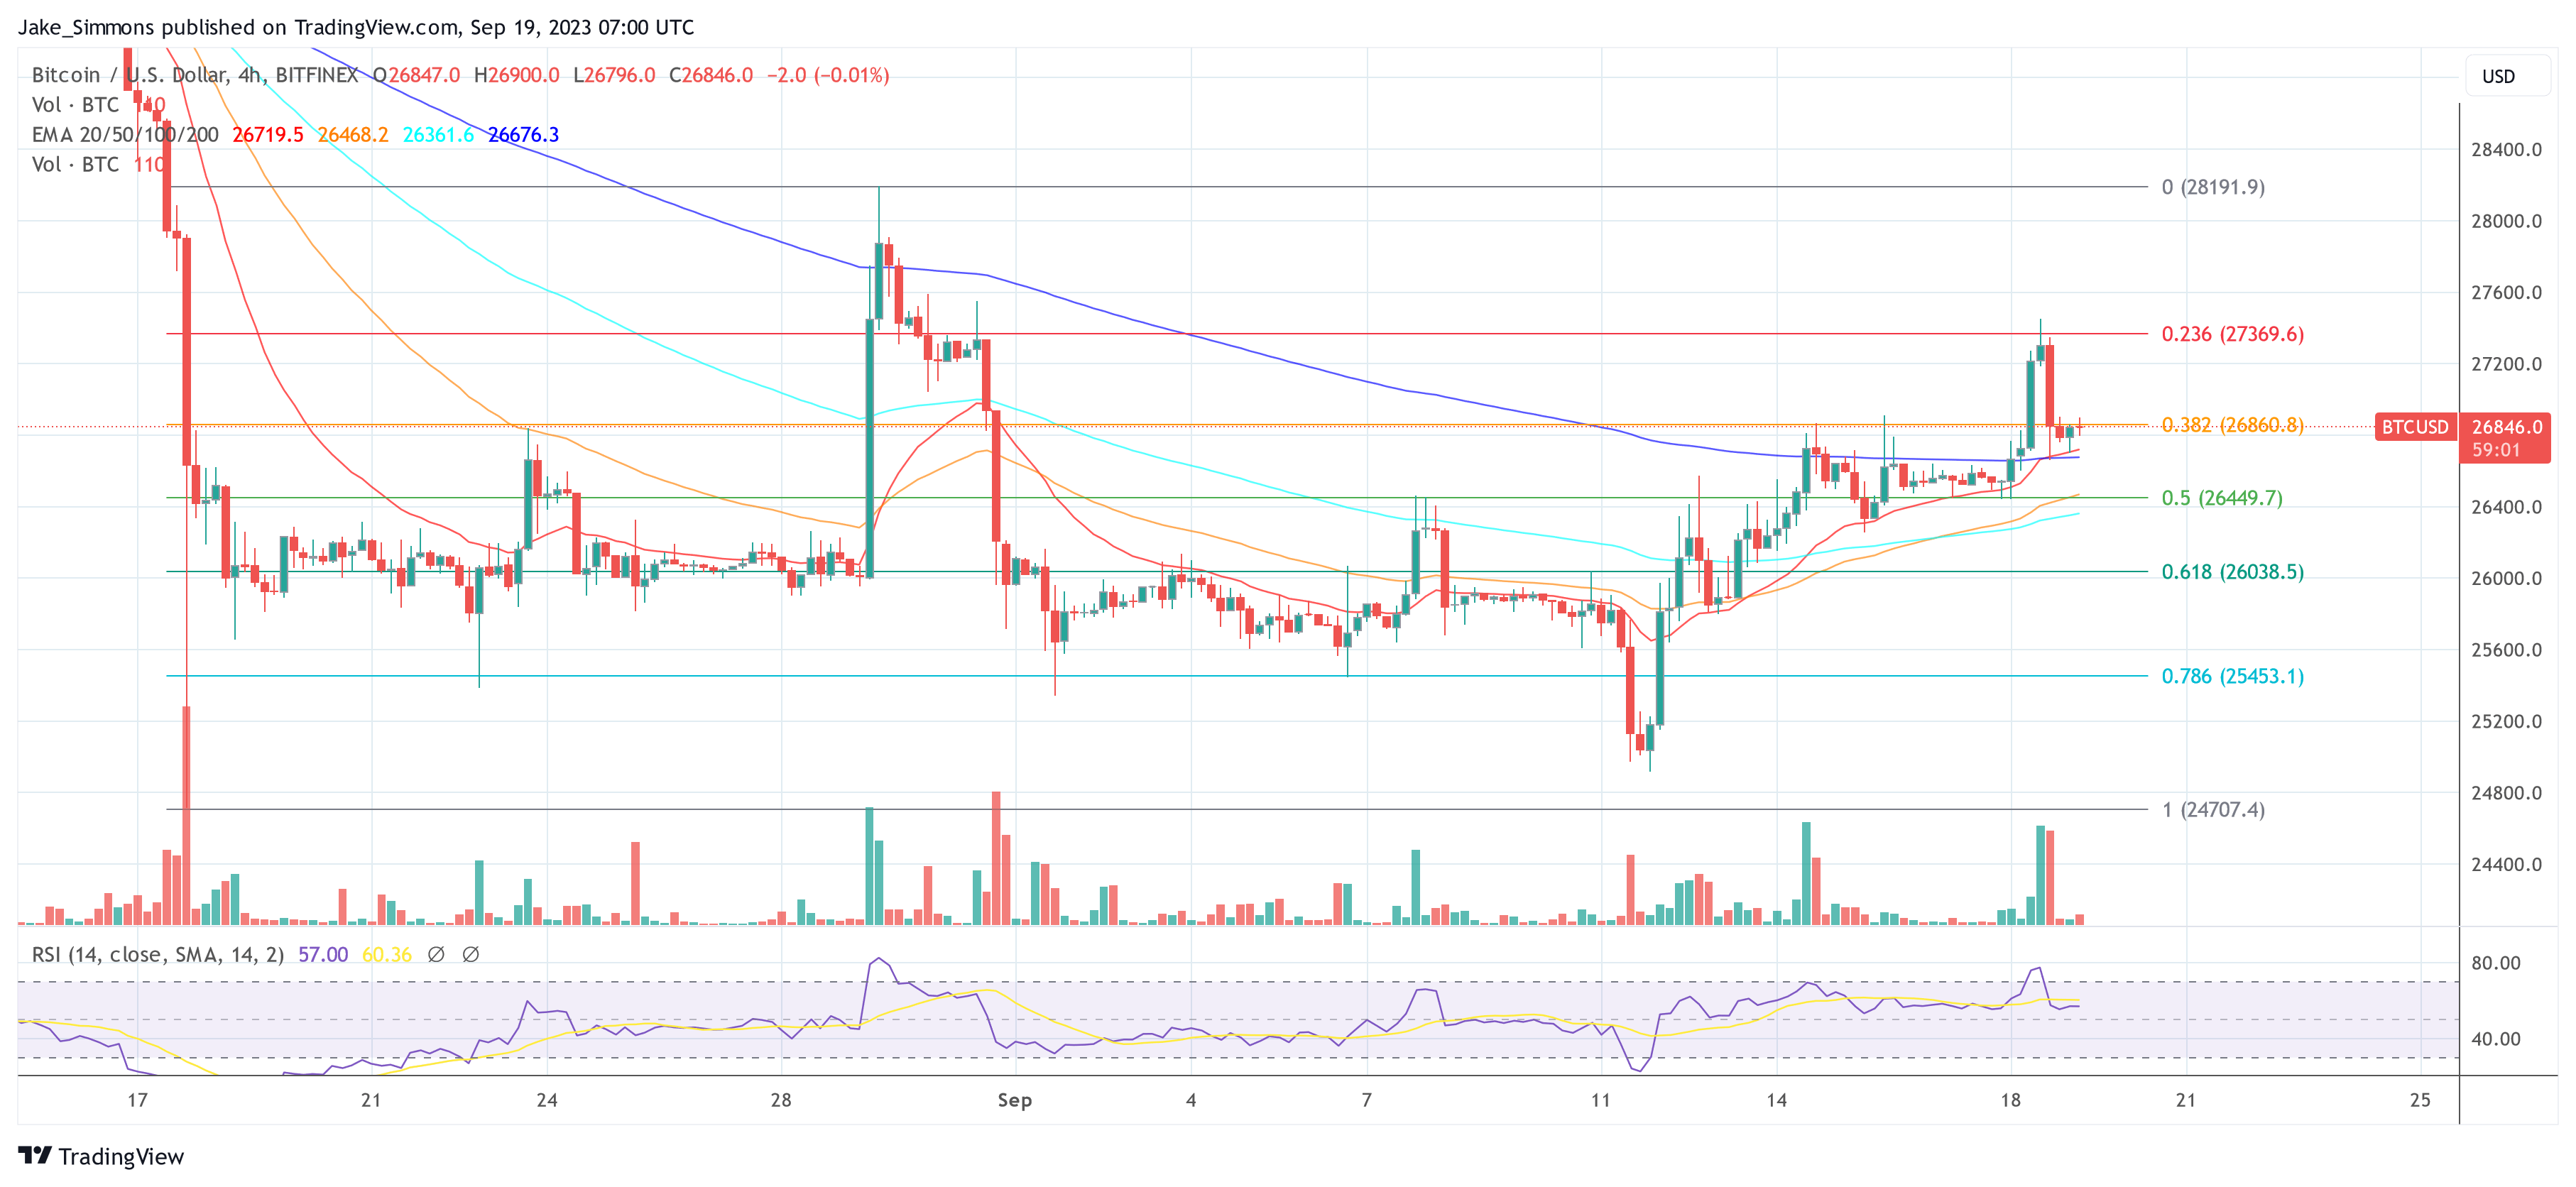
Featured image from iStock, chart from TradingView.com

