

Bitcoin Prices Are Going In Zig-zag Action With Enough Volatility For Another Two Months
April 7, 2020 by Ramiro Burgos
Bitcoin prices are going in zig-zag action with enough volatility for another two months. Giving us a lateral market between $3300 and $7000.
Long-Term Analysis
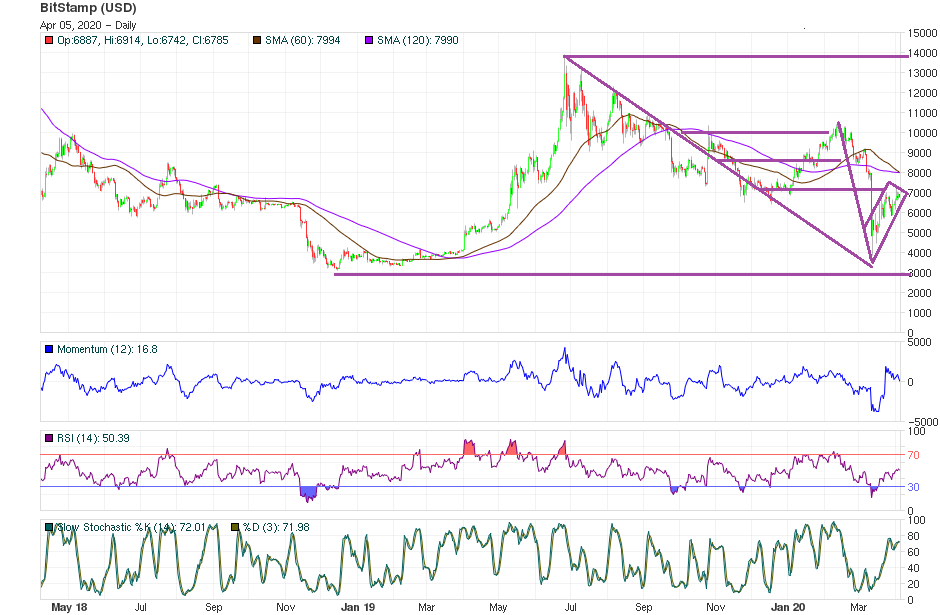
A new congestion area is arising between $3300 and $7000. Current quotes are covering the range up and down boosted by volatility. The churn could go on at least for another two months—a break out of it, perhaps to the upside. Following Mass Psychology´s phases and development, Hope turned into Disbelief rather than Optimism. Every YouTuber stopped spreading bullish opinions due to the bearish correction anticipated in the charts.
A distribution area is increasing its influence as demand decreases, to drive the same breakout idea down to next support near $3000 or below. External factors and financial news started bringing grounds to a natural integration of Bitcoin to global portfolios as an accepted asset in the mid-term future. So while the bullish idea gets back, values would go lateral until halving ends in May.
Mid-Term Analysis
After a big Head and Shoulders formation confirmed, bitcoin prices fell to $3800 and started a new side-ways movement. A partial reversal movement to $6800 and beyond took place as expected as a kind of confirmation to activate the current late $3000 basis points scenario. Still, after that happened, the downward would take place in $3000 during the zig-zag action.
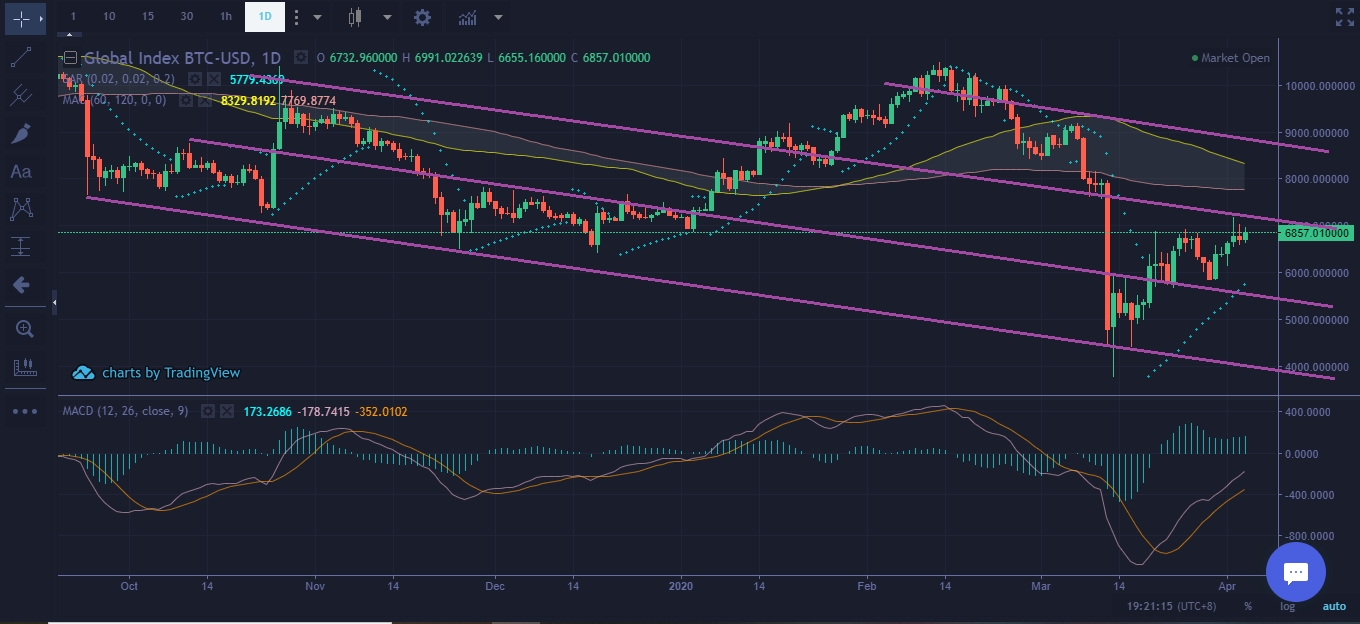
An inverted Flag formation activated a bearish target, which could be softened by positive political factors from traditional mass media. Measurable indicators work as a sustaining net to contextualize with traditional formations and to calculate every target.
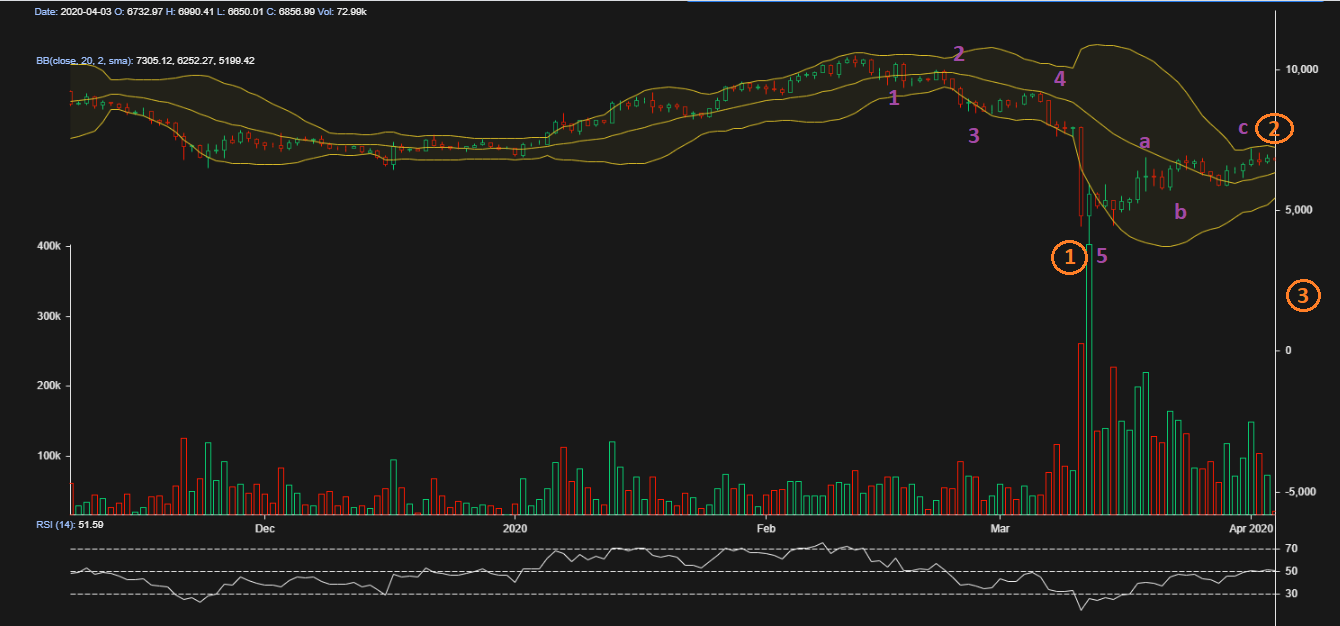
Japanese Candlestick evaluation favors the distribution with healthy crows defeating dispersed soldiers. Kicking them down to support a lower support area. This lowering action follows the Elliot Wave Theory, and anticipation of a bearish 3rd movement. Heading price quotes down to $3300, even as volatility provides some isolated peaks near $6000.
According to Fibonacci Fan lines, the next stage could be a central sustaining area arise plenty of volatility. After halving, demand´ soldiers should reorder themselves to clash against the crows with a chance to prevail, but for the moment, they can badly defend $4000 levels as support.
What do you think will happen to the bitcoin price? Share your predictions in the comments below.
If you find Ramiro’s analyses interesting or helpful, you can find out more about how he comes to his conclusions by checking out his primer book. The Manual de Análisis Técnico Aplicado a los Mercados Bursátiles.
The text covers the whole range of technical analysis concepts, from introductory to advanced and everything in between. To order, send an email to [email protected]

Images via Pixabay, Ramiro Burgos
This technical analysis is meant for informational purposes only. Bitsonline is not responsible for any gains or losses incurred while trading bitcoin.


