
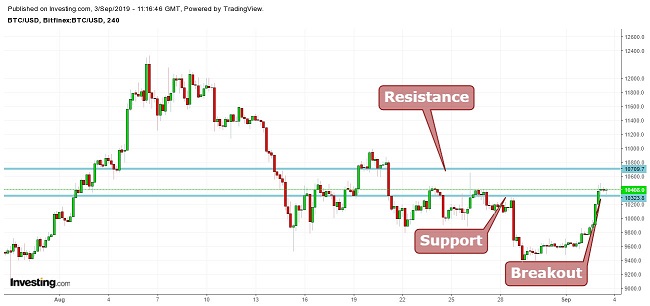
Bitcoin(BTC)trade is currently is trading at $10,423. Looking at the chart we see that the price has recently broken the resistance of $10,323. Long position can be taken, keeping $10,323 as support with a target price at $10,700. Swing trading can be done between the channels formed by the resistance and support.
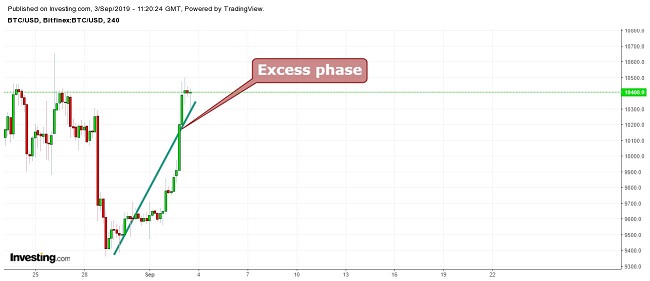
Dow Theory
According to Dow Theory, the Bitcoin price is in the excess phase, which is an extension to the public participation phase. Correction can usually be seen after the excess phase and then again, the price starts going up until it reaches the distribution phase. The trend is bullish in the participation phase.
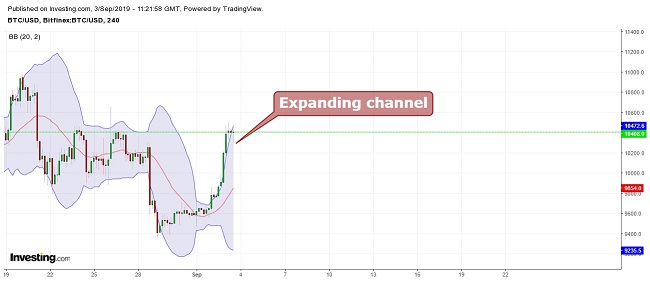
Bollinger Bands
The largest cryptocurrency’s price is moving between the channels, with the middle average line acting as support. The band is expanding, indicating increased volatility of the digital curerncy. The momentum is positive which indicates that the price will move upwards as long as it stays above the support level.

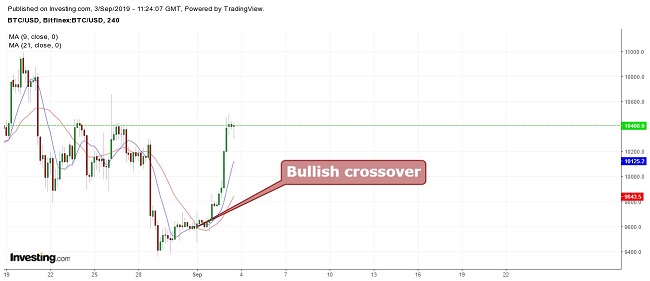
Moving Average
When taking 9 period moving averages (blue) with 21 period moving averages (red), a bullish crossover can be seen. The Bitcoin price is also moving above the moving averages, indicating an upward movement.
Conclusion
Bitcoin(BTC)trade is currently is trading at $10,423. The support level is at $10,323 and the resistance level at $10,700. The current trend is bullish and long positions can be taken as long as the cryptocurrency’s price stays above the $10,350 level.
If the price will close a day below the support level, it can drag the price back to the $9,900 level. A closing above $10,700 can take the price to the $11,000 level. Swing trading can be done using the $10,350 mark as support with a target price at around $10,670.
Pivot Points
| Name | S3 | S2 | S1 | Pivot Points | R1 | R2 | R3 |
| Classic | 7811.2 | 8585.8 | 9104.8 | 9879.4 | 10398.4 | 11173.0 | 11692.0 |
| Fibonacci | 8585.8 | 9079.9 | 9385.2 | 9879.4 | 10373.6 | 10678.9 | 11173.0 |
| Camarilla | 9268.2 | 9386.7 | 9505.3 | 9879.4 | 9742.5 | 9861.1 | 9979.6 |
| Woodie’s | 7683.6 | 8522.0 | 8977.2 | 9815.6 | 10270.8 | 11109.2 | 11564.4 |
Technical Indicators
| Name | Value | Action |
| RSI(14) | 60.266 | Buy |
| STOCH(9,6) | 34.983 | Sell |
| STOCHRSI(14) | 14.174 | Oversold |
| MACD(12,26) | 1139.700 | Buy |
| ADX(14) | 46.367 | Sell |
| Williams %R | -53.213 | Neutral |
| CCI(14) | -3.2924 | Neutral |
| ATR(14) | 1868.7826 | High Volatility |
| Highs/Lows(14) | 0.0000 | Neutral |
| Ultimate Oscillator | 48.950 | Sell |
| ROC | 21.797 | Buy |
| Bull/Bear Power(13) | 417.2075 | Buy |