
Analysis
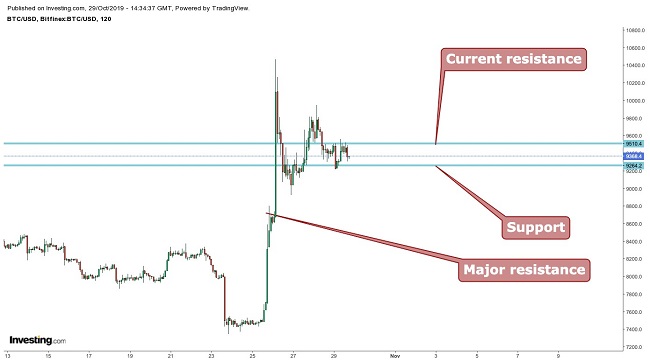
When looking at the chart below we see that Bitcoin(BTC)trade is currently trading at $9,357. It can also be observed that the largest cryptocurrency has recently broken the resistance of $8,650 with good volume, turning the sentiments positive.
But after the uptrend, Bitcoin’s price seems to be entering the channel with resistance at $9,510 and support at $9,264, as the price might continue trending sideways for a short while. Currently the price is moving towards the support level, and long positions can be taken around the support with a proper stoploss.
Dow Theory
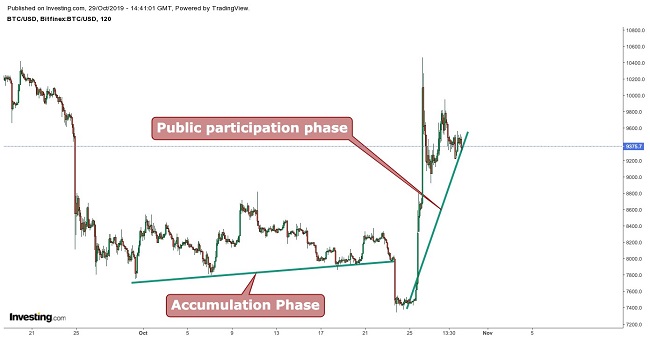
According to Dow Theory, the BTC price is in the public participation phase. During this phase, the financial asset catches the attention of new investors and a rapid price change occurs. This happens when trend followers and other technically-oriented investors participate. This phase continues until rampant speculations and general enthusiasm dissipate.
Bollinger Bands
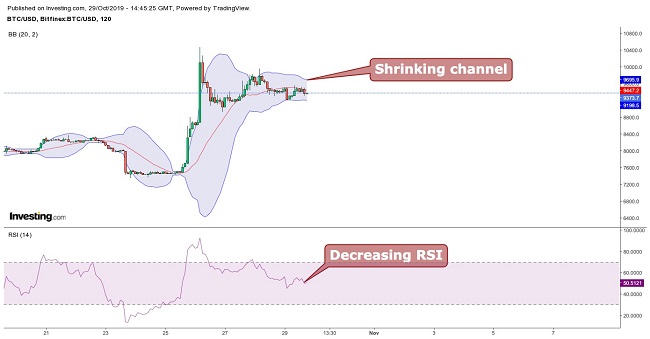
The Bitcoin price is moving between the channels with the lower channel limit acting as support and the middle average line acting as resistance. It can be seen that the channel was broken with a positive momentum which led to the uptrend.

However, now the channel is shrinking with the RSI decreasing, indicating a losing momentum and a greater probability of the price turning sideways. Swing trading can be done in this situation.
Moving Average
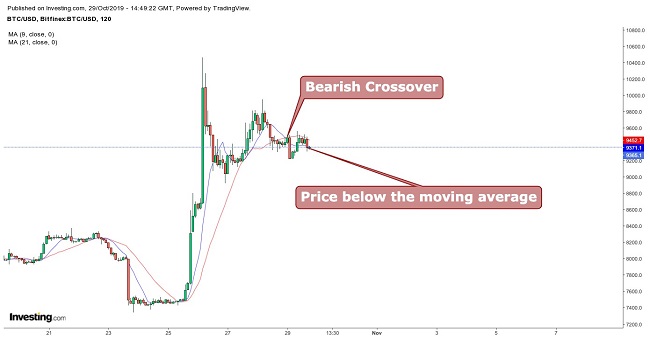
When taking 9 period moving averages (blue) with 21 period moving averages (red), a bearish crossover manifests itself with the BTC price trading below the 9 and 21 period moving averages. It is suggested to wait until the price closes a day above the moving averages before taking a long position.
Conclusion
Bitcoin(BTC)trade is currently trading at $9,357. The first resistance is at $9,510 and support is at $9,264. Although the cryptocurrency’s price has broken the resistance of $8,650, now it is stuck, facing the strong resistance of $9,510.
During this situation, short term trades can be taken as the price is expected to enter the channel and to trade within it for some time. The upper and lower limits of the channel can be used for swing trading. A close above $9,550 can take the price up to the $10,300 levels, while a close below $9,264 can drag the price down back to the $8,600 levels. The positive momentum appears to be fading and turning towards an indecision.
Pivot Points
| Name | S3 | S2 | S1 | Pivot Points |
R1 | R2 | R3 |
| Classic | 4464.3 | 5902.9 | 7586.9 | 9025.5 | 10709.5 | 12148.1 | 13832.1 |
| Fibonacci | 5902.9 | 7095.7 | 7832.7 | 9025.5 | 10218.3 | 10955.3 | 12148.1 |
| Camarilla | 8412.2 | 8698.4 | 8984.7 | 9025.5 | 9557.1 | 9843.4 | 10129.6 |
| Woodie’s | 4586.9 | 5964.2 | 7709.5 | 9086.8 | 10832.1 | 12209.4 | 13954.7 |
Technical Indicators
| Name | Value | Action |
| RSI(14) | 53.597 | Neutral |
| STOCH(9,6) | 30.868 | Sell |
| STOCHRSI(14) | 36.317 | Sell |
| MACD(12,26) | 497.500 | Buy |
| ADX(14) | 26.326 | Neutral |
| Williams %R |
-59.523 | Sell |
| CCI(14) | -14.0128 | Neutral |
| ATR(14) | 1400.0643 | Less Volatility |
| Highs/Lows(14) | 0.0000 | Neutral |
| Ultimate Oscillator |
45.215 | Sell |
| ROC | -1.208 | Sell |
| Bull/Bear Power(13) |
642.6556 | Buy |