

Analysis
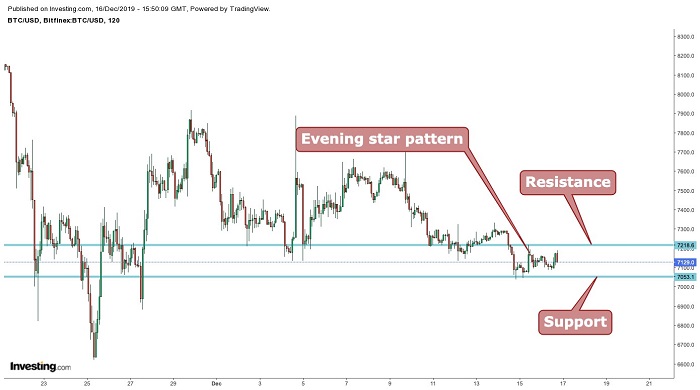
When we look at the chart below, we can observe that Bitcoin(BTC)trade is trading at $7,120. It can also be seen that that price is stuck within the channel.
The upper limit is at $7,218, confirmed by the formation of an evening star pattern, and is also acting as resistance; and $7,053 is acting as support. The world’s largest cryptocurrency’s price is expected to trade inside the channel for some time.
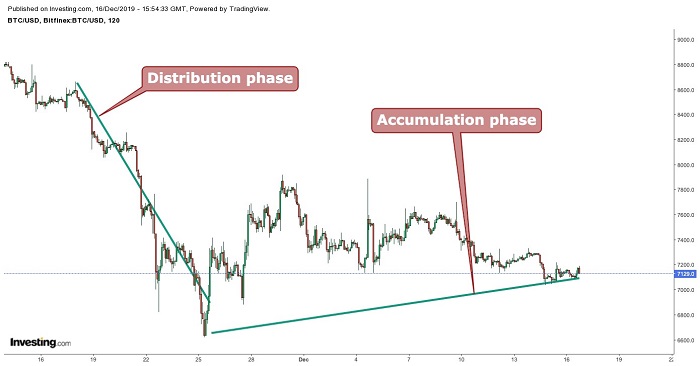
Dow Theory
The Bitcoin price is currently appearing in the accumulation phase. This is a period when informed and educated investors are actively buying the digital currency against the general opinion of the crypto market. During this phase, the BTC price does not change much because these investors are in the minority demanding virtual currency that the market at large is selling.
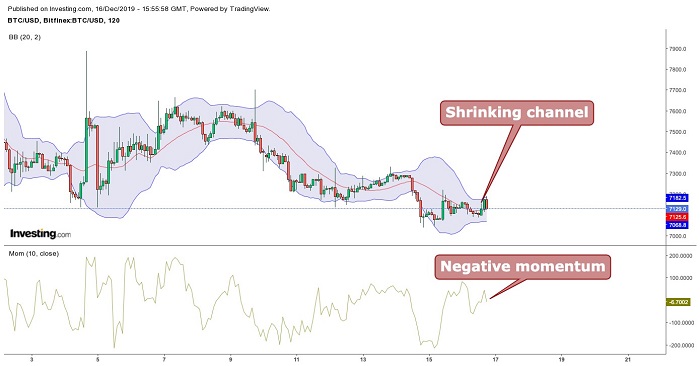
Bollinger Bands
Bitcoin’s price is moving between the channels with the middle average line acting as support and the upper limit acting as resistance. It can be seen that the channel is shrinking with a negative momentum, which indicates decreased volatility with a bearish sentiment.
Therefore some correction is expected, and taking long positions is not suggested. Also, it shows indecision so the Bitcoin price is expected to trade between the channels without much movement.
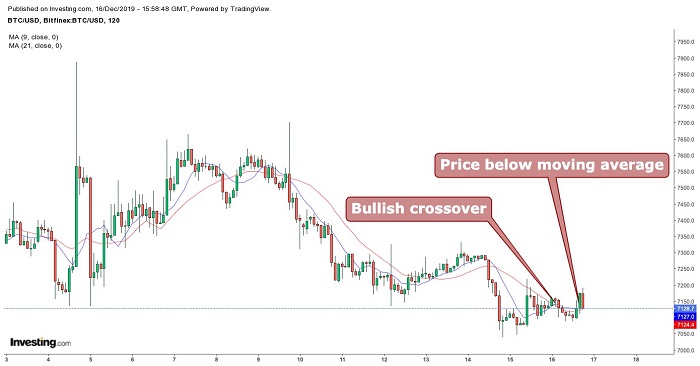
Moving Average
When taking 9 period moving averages (blue) with 21 period moving averages (red), a bullish crossover is formed but the cryptocurrency’s price is trading below the 9 period moving average.
These conflicting signs indicate indecision. It is suggested to wait until the digital currency’s price starts trading above the moving average before taking any long positions.
Conclusion
The price of Bitcoin(BTC)trade is trading at $7,120. The resistance is at $7,218 with support at $7,053. It is suggested not to take long positions at this price as it is struck between the channels and is expected to touch the support.
Any long position can be taken around the support level with a target price around the resistance level. Only swing trading is suggested as there is not indication of a breakout. The above mentioned levels can be used for swing trading. A close below $7,053 can drag the price down to the $6,600 levels. A close above $7,300 can take the price all the way up to $7,500.
Pivot Points
| Name | S3 | S2 | S1 | Pivot Points | R1 | R2 | R3 |
| Classic | 7098.2 | 7124.4 | 7137.5 | 7163.7 | 7176.8 | 7203.0 | 7216.1 |
| Fibonacci | 7124.4 | 7139.4 | 7148.7 | 7163.7 | 7178.7 | 7188.0 | 7203.0 |
| Camarilla | 7139.8 | 7143.4 | 7147.0 | 7163.7 | 7154.2 | 7157.8 | 7161.4 |
| Woodie’s | 7091.6 | 7121.1 | 7130.9 | 7160.4 | 7170.2 | 7199.7 | 7209.5 |
Technical Indicators
| Name | Value | Action |
| RSI(14) | 49.734 | Neutral |
| STOCH(9,6) | 49.579 | Neutral |
| STOCHRSI(14) | 37.969 | Sell |
| MACD(12,26) | 5.800 | Buy |
| ADX(14) | 17.986 | Neutral |
| Williams %R | -59.184 | Sell |
| CCI(14) | 59.9468 | Buy |
| ATR(14) | 25.7396 | High Volatility |
| Highs/Lows(14) | 0.0000 | Neutral |
| Ultimate Oscillator | 46.871 | Sell |
| ROC | -0.014 | Sell |
| Bull/Bear Power(13) | 20.8103 | Buy |


