Bitcoin price this morning touched $50,000 – a feat that might have have made a bear market look a lot less likely. But bulls could be celebrating too early, and a max pain scenario of a symmetrical triangle few currently see could end up shaking up both bears and bulls in the days ahead.
Here is a much closer look at the symmetrical triangle, what the corrective pattern suggests, and why bulls certainly aren’t out of the woods just yet.
Downtrend Remains Unbroken, Symmetrical Triangle Possible
Downtrends can be deceiving. They don’t always necessarily mean a bear market, and even if a downtrend line is broken, another one can form higher and prevent the reaction bulls are expecting.
Related Reading | Could A Bitcoin Bull Flag Leave Bears Blindsided?
For example, when Bitcoin broke out from bear market downtrend resistance, the early 2019 rally to $13,000 was the result. However, because of the new downtrend line created at that high, Bitcoin spent another full year and then some below the new downtrend resistance.
There is still one more downtrend resistance to go before bulls are out of the woods | Source: BTCUSD on TradingView.com
Assets often must clear three opposing trendlines for the primary trend to resume. This situation is happening now, but on much smaller time scales. Bitcoin price has made it through two downtrend lines, but one is left.
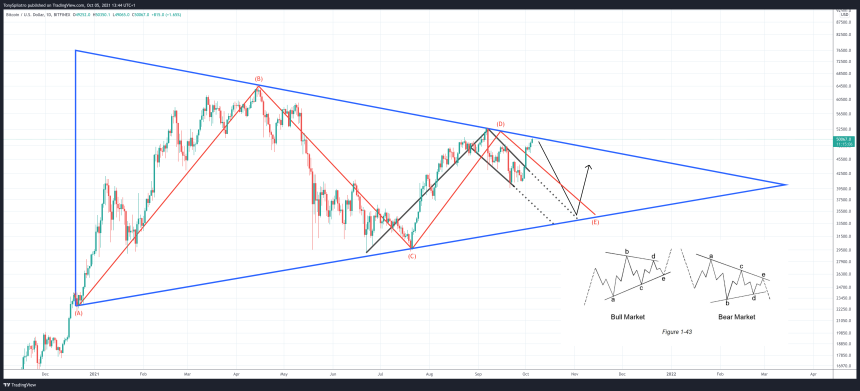
Drawing a symmetrical support line provides the potential for the triangle that few technical analysts are talking about currently. Valid trendlines tend to have at least three touches, but the third touch could provide the final E-wave of a triangle corrective pattern during a bull market.
The wave 4 correction could be an Elliott Wave triangle pattern | Source: BTCUSD on TradingView.com
Bitcoin Price Corrective Wave Could Be Nearing Its End
The E-wave could clear out any positions built at support around $40,000, crushing bulls who went all in on what they thought was a bull flag breakout. The move would also restore bearish exuberance, and push Bitcoin price back into the $30,000 range to suck in more short positions.
Only then might Bitcoin price make it through the top downtrend line to continue higher. But it all depends on where the E-wave “terminates.” It is worth noting that a such a triangle during a bull market often leads to new highs.
Related Reading | Bulls Regain Control Over Bitcoin Trend Strength: What To Expect
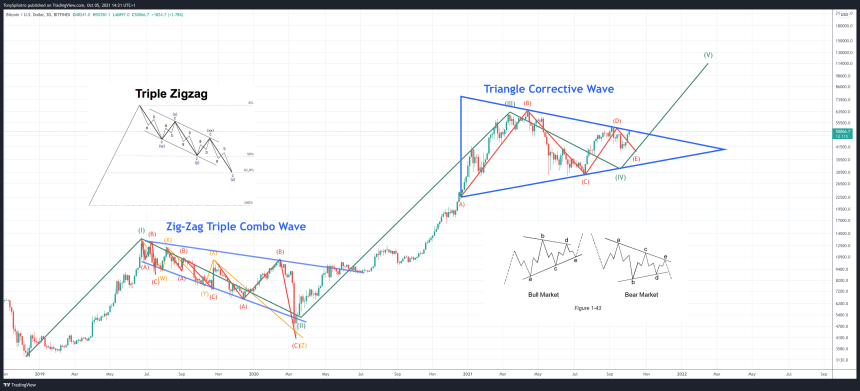
An Elliott Wave corrective triangle will appear during a wave 2 or 4 of a motive wave, which represents the primary trend. An Elliott wave corrective triangle and its higher lows would keep the bull run structure in tact, and fit the Elliott Wave rule of wave alternation.
If Bitcoin is in a motive wave, wave 5 should begin soon | Source: BTCUSD on TradingView.com
This rule suggests that only one of the two corrective waves – wave 2 or 4 – will result in a sharp correction. The other would be a sideways correction lacking a lower low. Not only do corrective waves tend to alternate in overall severity, the patterns tend to switch. This means that if wave 2 was an Elliott Wave zig-zag, then wave 4 would be a flat, triangle, or other pattern.
Eliott Wave Theory provides the roadmap for a trend. The roadmap continues to say until proven otherwise, that once wave 4 ends, wave 5 begins. But for now, bulls aren’t yet out of the woods and a sweep of lows could still be possible.
Follow @TonySpilotroBTC on Twitter or via the TonyTradesBTC Telegram. Content is educational and should not be considered investment advice.
Featured image from iStockPhoto, Charts from TradingView.com


