

Bitcoin price is up over 5% and it cleared the $45,000 resistance. BTC is showing positive signs on rumors of spot ETF approval by the EOD.
- Bitcoin is gaining pace above the $44,000 and $44,400 resistance levels.
- The price is trading above $45,000 and the 100 hourly Simple moving average.
- There was a break above a key ascending channel with resistance near $43,500 on the hourly chart of the BTC/USD pair (data feed from Kraken).
- The pair is up over 5% after several rumors of BTC spot ETF approval by EOD.
Bitcoin Price Rallies Above $45K
Bitcoin price formed a base above the $41,200 level and started a fresh increase. BTC cleared a few major barriers near $43,200 to enter a bullish zone.
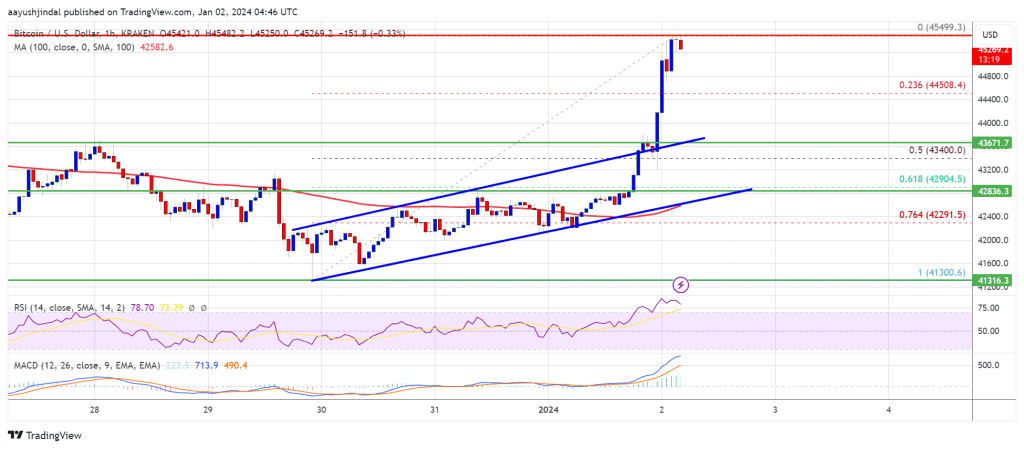
Several rumors circulating that spot ETF approval is possible by the end of today. The price is gaining pace on this rumor and broke the $44,000 level. There was also a break above a key ascending channel with resistance near $43,500 on the hourly chart of the BTC/USD pair.
Bitcoin even cleared the $45,000 resistance. A new multi-week high is formed near $45,499 and the price is now consolidating gains. It is trading well above the 23.6% Fib retracement level of the upward move from the $41,300 swing low to the $45,499 high.
Bitcoin is also trading above $45,000 and the 100 hourly Simple moving average. On the upside, immediate resistance is near the $45,500 level.
Source: BTCUSD on TradingView.com
The first major resistance is $46,000. A close above the $46,000 level could send the price further higher. The next major hurdle sits at $46,800. Any more gains above the $46,800 level could open the doors for a move toward the $48,000 level.
Are Dips Attracted In BTC?
If Bitcoin fails to rise above the $45,500 resistance zone, it could start a downside correction. Immediate support on the downside is near the $45,000 level.
The next major support is near $44,500. If there is a move below $44,500, there is a risk of more losses. In the stated case, the price could drop toward the $43,500 support in the near term.
Technical indicators:
Hourly MACD – The MACD is now gaining pace in the bullish zone.
Hourly RSI (Relative Strength Index) – The RSI for BTC/USD is now above the 50 level.
Major Support Levels – $45,500, followed by $46,800.
Major Resistance Levels – $45,000, $44,500, and $43,500.
Disclaimer: The article is provided for educational purposes only. It does not represent the opinions of NewsBTC on whether to buy, sell or hold any investments and naturally investing carries risks. You are advised to conduct your own research before making any investment decisions. Use information provided on this website entirely at your own risk.


