

Bitcoin is up close to 4% and it broke the key $7,000 resistance zone against the US Dollar. BTC price is likely to surge towards $8,000 if it clears the $7,280-$7,300 resistance zone.
- Bitcoin remained well bid and it started a fresh increase above $7,000 against the US Dollar.
- The bears failed to push the price below the $6,750-$6,800 support zone.
- There was a break above a major bearish trend line with resistance near $7,035 on the hourly chart of the BTC/USD pair (data feed from Kraken).
- The pair is likely to accelerate towards the $8,000 level if it successfully clears the $7,280-$7,300 hurdle.
Bitcoin Showing Bullish Signs
Yesterday, bitcoin bears made a couple of attempts to push the price further lower below $6,800 against the US Dollar. They failed and it resulted in a bullish reaction in BTC above the $6,950 and $7,000 resistance levels.
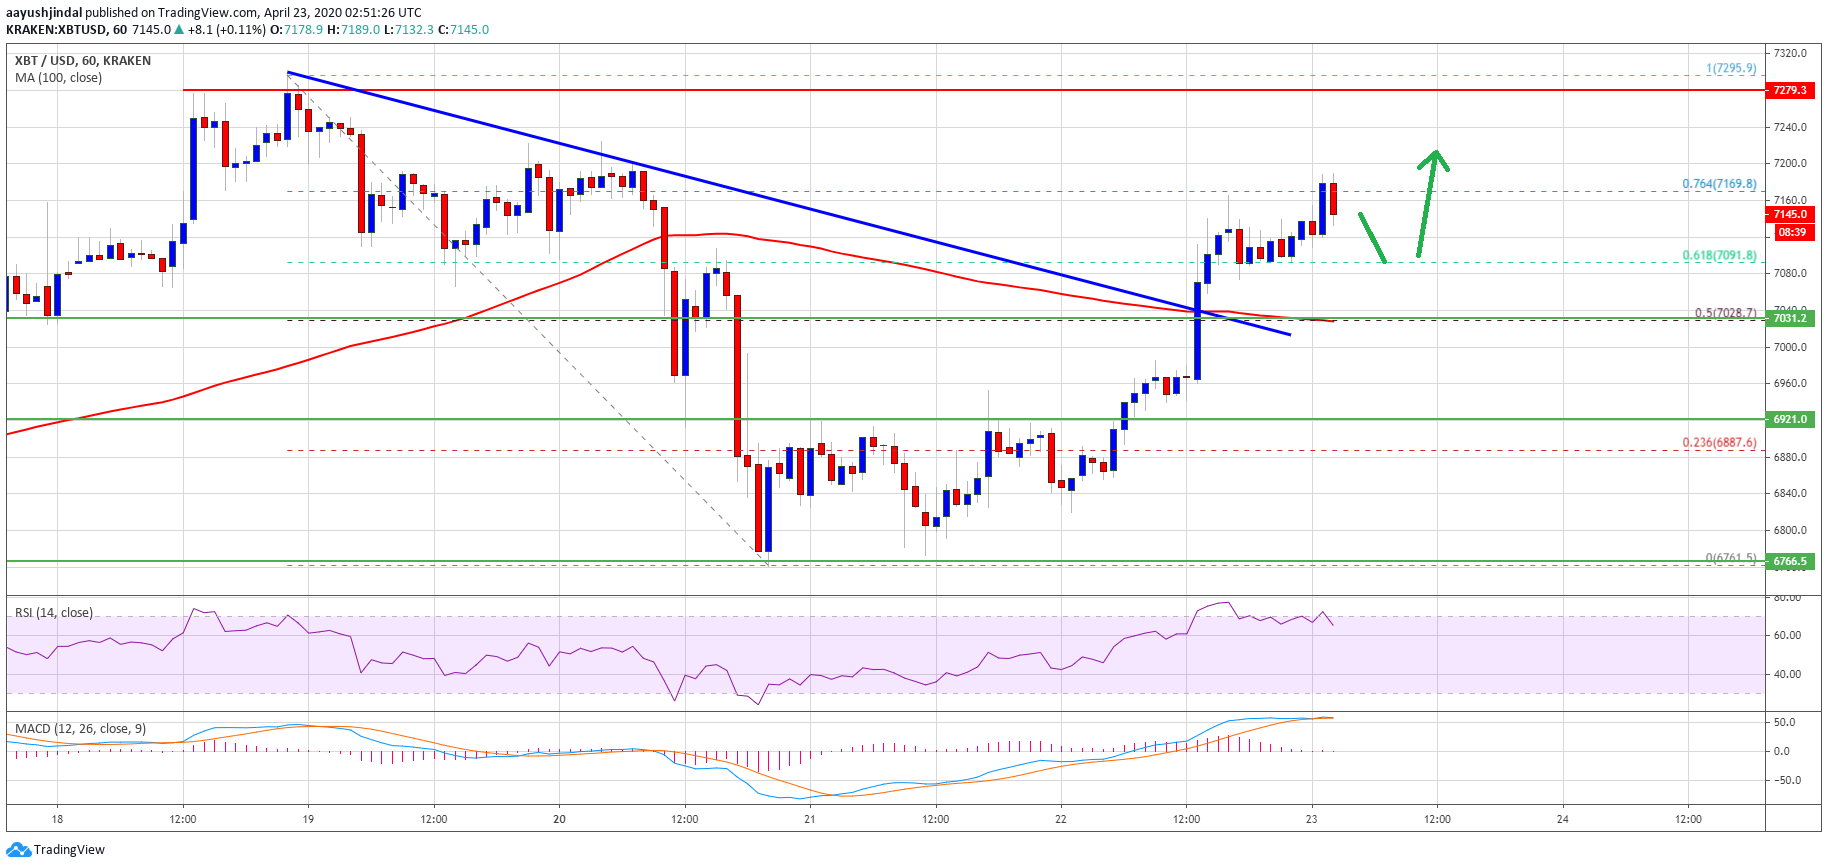
The price even settled above the $7,000 level and the 100 hourly simple moving average. There was a clear break above the 50% Fib retracement level of the las key decline from the $7,295 high to $6,760 swing low.
More importantly, there was a break above a major bearish trend line with resistance near $7,035 on the hourly chart of the BTC/USD pair. The pair is now trading above the $7,100 level and approaching the $7,200 resistance.
It seems like the 76.4% Fib retracement level of the las key decline from the $7,295 high to $6,760 swing low is acting as a resistance. The main resistance on the upside is near the $7,280-$7,300 region.
If bitcoin successfully clears the $7,280-$7,300 hurdle, there could be a sharp upward move. An initial resistance is near the $7,500 level, above which the bulls are likely to aim a test of the $8,000 handle in the coming sessions.
Resistance Turned Support
If bitcoin starts a downside correction, it could revisit the $7,030 and $7,000 support levels. Besides, the 100 hourly simple moving average is also near the $7,030 level to act as a strong buy zone.
Any further losses below $7,000 and the 100 hourly SMA could negate the current bullish view. In the mentioned case, the price might revisit the $6,760 swing low in the near term.
Technical indicators:
Hourly MACD – The MACD is slowly reducing its bullish zone.
Hourly RSI (Relative Strength Index) – The RSI for BTC/USD is currently correcting lower from the 70 level.
Major Support Levels – $7,030 followed by $7,000.
Major Resistance Levels – $7,200, $7,280 and $7,500.
Iimage from unsplash.


