

Bitcoin price started an upside correction from the $26,550 zone. BTC is rising and facing a strong resistance near the $27,300 and $27,500 levels.
- Bitcoin managed to recover above the $27,000 resistance zone.
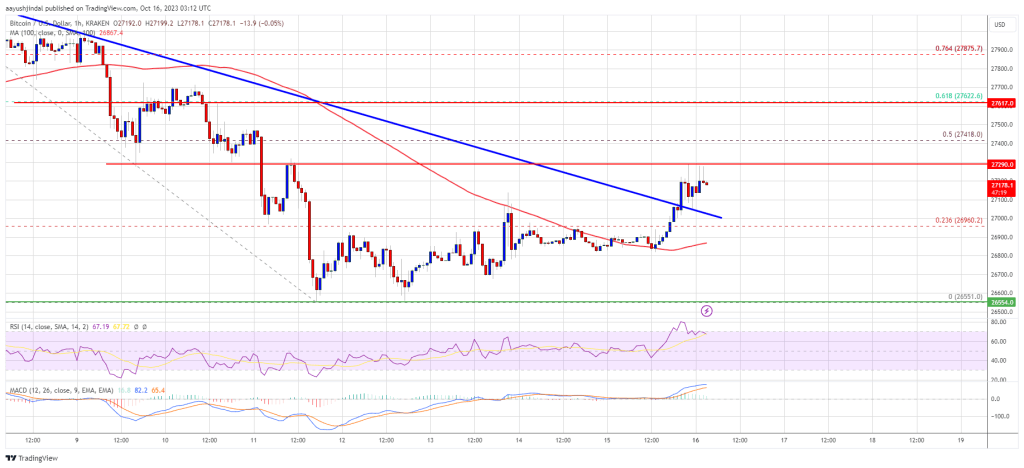
- The price is trading above $27,000 and the 100 hourly Simple moving average.
- There was a break above a major bearish trend line with resistance near $27,000 on the hourly chart of the BTC/USD pair (data feed from Kraken).
- The pair is showing signs of a recovery, but it could struggle near $27,300 and $27,500.
Bitcoin Price Attempts Fresh Recovery
Bitcoin price found support near the $26,550 level. BTC bears attempted to clear $26,550, but they failed. As a result, the price started an upside correction above the $26,800 resistance.
There was a move above the 23.6% Fib retracement level of the downward move from the $28,285 swing high to the $26,550 low. Besides, there was a break above a major bearish trend line with resistance near $27,000 on the hourly chart of the BTC/USD pair.
Bitcoin is now trading above $27,000 and the 100 hourly Simple moving average. It seems like the price is facing a strong resistance near the $27,300 level.
The next key resistance could be near $27,500 or the 61.8% Fib retracement level of the downward move from the $28,285 swing high to the $26,550 low. A clear move above the $27,500 and $27,650 resistance levels could set the pace for a larger increase.
Source: BTCUSD on TradingView.com
The next key resistance could be $28,000. A close above the $28,000 resistance might start a steady increase toward the $28,500 level. Any more gains might send BTC toward the $29,200 level.
Another Decline In BTC?
If Bitcoin fails to recover higher above the $27,500 resistance, there could be a fresh decline. Immediate support on the downside is near the $27,000 level and the trend line zone.
The next major support is near the $26,900 level and the 100 hourly Simple moving average. A downside break and close below the $26,900 support might send the price further lower. The next support sits at $26,550.
Technical indicators:
Hourly MACD – The MACD is now losing pace in the bullish zone.
Hourly RSI (Relative Strength Index) – The RSI for BTC/USD is now above the 50 level.
Major Support Levels – $27,000, followed by $26,900.
Major Resistance Levels – $27,300, $27,500, and $27,650.


