

Bitcoin price is consolidating above the $26,000 support. BTC could start a recovery wave if it clears the $26,500 resistance zone in the near term.
- Bitcoin is still consolidating above the $26,000 support zone.
- The price is trading below $26,400 and the 100 hourly Simple moving average.
- There is a major bearish trend line forming with resistance near $26,300 on the hourly chart of the BTC/USD pair (data feed from Kraken).
- The pair could start a decent recovery wave unless there is a clear move below $26,000.
Bitcoin Price Eyes Recovery
Bitcoin price remained stable above the $26,000 support zone. BTC seems to be forming a short-term support base above the $26,000 level and is currently consolidating.
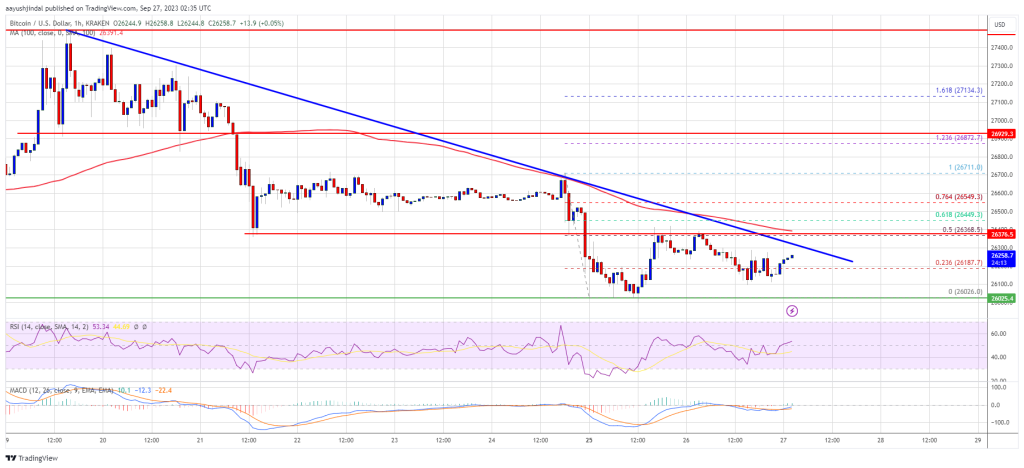
Recently, the price made a recovery wave attempt above the $26,200 level. However, the bears remained active below the $26,500 level. They rejected the 50% Fib retracement level of the downward move from the $26,712 swing high to the $26,026 low.
Bitcoin is now trading below $26,400 and the 100 hourly Simple moving average. Immediate resistance on the upside is near the $26,300 level. There is also a major bearish trend line forming with resistance near $26,300 on the hourly chart of the BTC/USD pair.
The next key resistance could be near the $26,350 level or the 100 hourly Simple moving average, above which the price could revisit the $26,500 resistance or the 76.4% Fib retracement level of the downward move from the $26,712 swing high to the $26,026 low.
Source: BTCUSD on TradingView.com
To start a recovery wave, the price must settle above $26,500. In the stated case, the price could climb toward the $27,000 resistance. Any more gains might call for a move toward the $27,500 level.
More Losses In BTC?
If Bitcoin fails to start a fresh increase above the $26,300 resistance, it could continue to move down. Immediate support on the downside is near the $26,050 level.
The next major support is near the $26,000 level. A downside break and close below the $26,000 level might start another major decline. The next support sits at $25,400. Any more losses might call for a test of $25,000.
Technical indicators:
Hourly MACD – The MACD is now losing pace in the bearish zone.
Hourly RSI (Relative Strength Index) – The RSI for BTC/USD is now near the 50 level.
Major Support Levels – $26,050, followed by $26,000.
Major Resistance Levels – $26,300, $26,500, and $27,000.


