

A recent report by the research firm Delphi Digital illustrates the predictable consistency of price action and trends within the crypto market. The report delves into the interconnectedness between the four-year Bitcoin (BTC) cycle and broader economic trends.
According to Delphi Digital analysts, the ongoing consolidation at $30,000 is similar to the period between 2015 and 2017, with indicators pointing toward an all-time high (ATH) for Bitcoin by the fourth quarter of 2024.
Economic cycle’s impact on Bitcoin’s performance
Delphi’s analysis draws attention to the inherent cyclical nature of the cryptocurrency market. This cyclicality is demonstrated by the timing between peak-to-trough bottoms, recovery periods to previous cycle highs and the timing of price rallies to new cycle tops. Using Bitcoin as a benchmark, Delphi outlines the general blueprint of a cryptocurrency market cycle.
These four-year cycles include Bitcoin hitting a new ATH, experiencing an approximate 80% drawdown, then a bottom around one year later. This tends to be followed by a two-year recovery to prior highs and, finally, a price rally for another year leading to a new all-time high.
The research reveals a fascinating correlation between Bitcoin price peaks and changes in the business cycle, as indicated by the ISM Manufacturing Index.
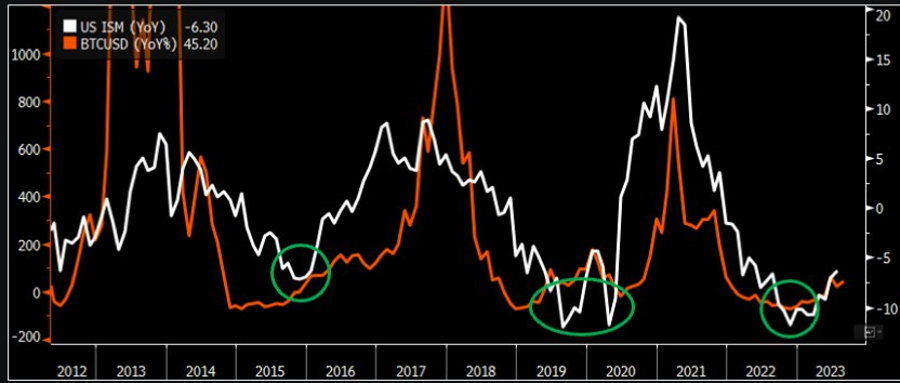
During Bitcoin’s price peaks, the ISM often demonstrates signs of topping out, and active addresses, transaction volumes and fees reach their highest point. Conversely, as the business cycle signals recovery, so do network activity levels.
The report emphasizes the Bitcoin halving’s role in these cycles. The last two halvings occurred about 18 months after BTC bottomed and roughly seven months before a new ATH. This historical pattern indicates a projected new ATH for Bitcoin by the fourth quarter of 2024, aligning with the expected timing of the next halving.
Bitcoin price action looks similar to the 2015-2017 pre-bull run phase
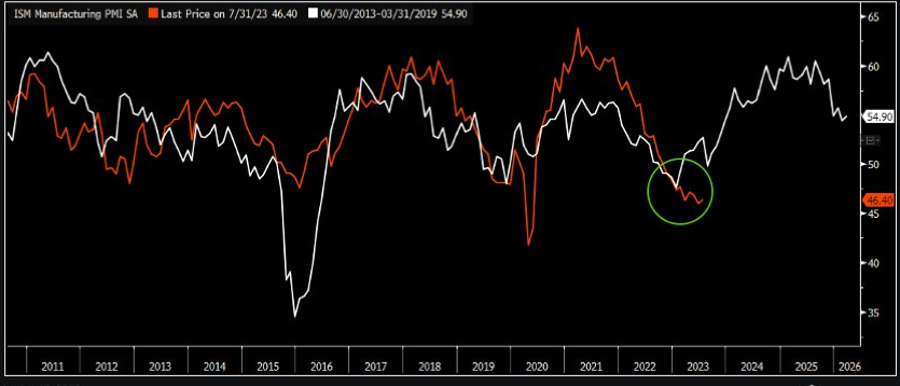
The report also suggests that the current market environment shares striking similarities with the period between 2015 and 2017. The alignment of market behavior, economic indicators and historical trends indicates that the current phase is akin to a time of increased risk exposure and potential growth, just as was experienced during that period.
The report notes that the market’s trading patterns, especially in the S&P 500, closely resemble the trajectory observed during 2015-2017. Even during times of uncertainty, such as an earnings recession, these patterns persist, mirroring the sentiment of that period.
The consistent pattern of Bitcoin’s cycle, its synchronization with broader economic shifts and the imminent halving in 2024 all contribute to this thesis.
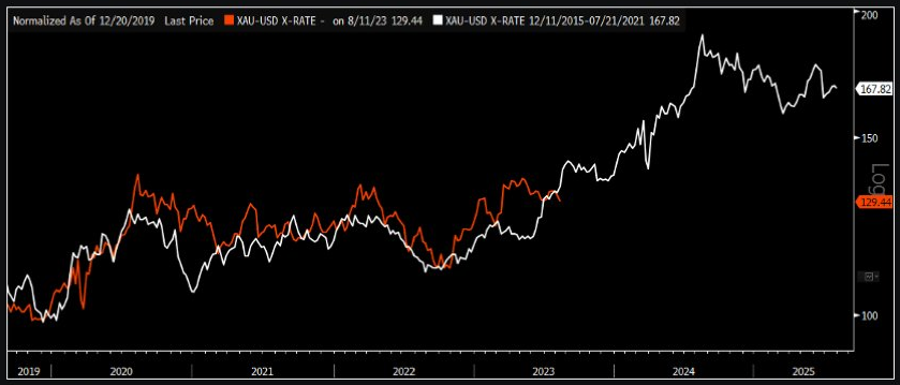
Delphi highlights parallels between the bleak global growth outlook during 2015-2016 and the recent period of economic uncertainty in 2021-2022. Factors such as the strength of the U.S. dollar and changes in global liquidity cycles echo the past.
The report underscores how gold’s performance around that time, influenced by currency debasement concerns, exhibits remarkable similarities to the present. These parallels bolster the argument that macroeconomic conditions are following a familiar trajectory.
Related: Is Bitcoin’s record-low volatility and decline in short-term holders a bull market signal?
The crypto market reflects an optimistic outlook, with some red flags
Delphi’s analysis provides compelling evidence that the crypto market operates within cyclical patterns that mirror broader economic changes. The report’s prediction of a new all-time high by the fourth quarter of 2024 aligns with historical halving patterns. This timing, coupled with the state of indicators like the ISM and expectations of renewed liquidity cycles, strengthens the argument for a cycle akin to the one seen in 2015-2017.
The upcoming Bitcoin halving in 2024 further adds credence to the firm’s expectations of a possible bull market by the fourth quarter of that year. While the analysis is not without its risks and uncertainties, the overall outlook for the cryptocurrency market in the next 12-18 months appears promising, given the stacking catalysts and historical precedent.
This article is for general information purposes and is not intended to be and should not be taken as legal or investment advice. The views, thoughts, and opinions expressed here are the author’s alone and do not necessarily reflect or represent the views and opinions of Cryptox.


