

Bitcoin traded as high as $9,950 and recently started a downside correction against the US Dollar. BTC price is likely to remains well supported above $9,000 and it could continue higher.
- Bitcoin is currently correcting lower from the $9,950 and $10,000 resistance levels.
- The price is still trading well above the $9,200 support and the 100 hourly simple moving average.
- There is a crucial bullish trend line forming with support near $9,210 on the hourly chart of the BTC/USD pair (data feed from Kraken).
- The pair could correct lower towards $9,200 and $9,000, but it is likely to bounce back.
Bitcoin Correcting Gains
There was a steady rise in bitcoin price above the $9,200 and $9,500 resistance levels against the US Dollar. BTC price extended its rise above the $9,700 level and the 100 hourly simple moving average.
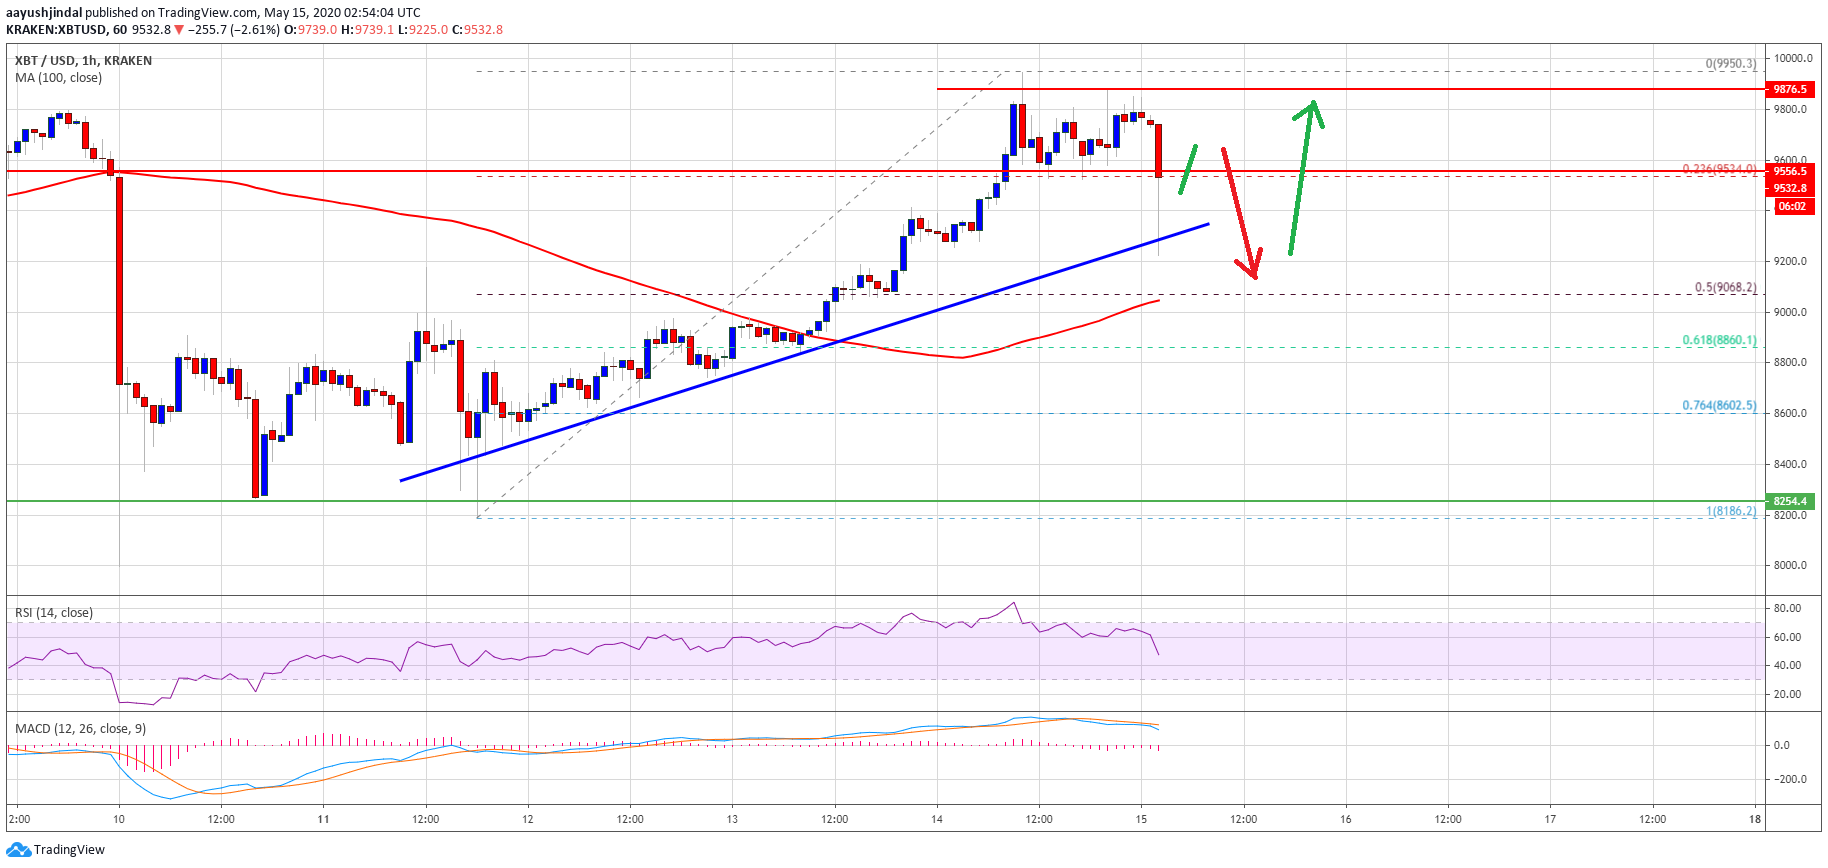
It even traded close to the $10,000 resistance (as discussed in yesterday’s post). However, the bulls failed to gain strength for more gains above $9,950 and $10,000. A high was formed near $9,950 and the price is currently correcting lower.
It traded below the $9,600 level, and the 23.6% Fib retracement level of the upward move from the $8,186 swing low to $9,950 high. Bitcoin even spiked below the $9,400 and $9,300 levels.
However, the bulls defended the $9,200 support zone (the previous key resistance). There is also a crucial bullish trend line forming with support near $9,210 on the hourly chart of the BTC/USD pair.
If there is a downside break below the trend line, the price could continue to move down towards the $9,070 support zone since it is close to the 100 hourly simple moving average. The 50% Fib retracement level of the upward move from the $8,186 swing low to $9,950 high is also near $9,070.
Once the current correction wave is complete, the price is likely to bounce back from $9,200 or $9,080 in the coming sessions.
Bearish Reversal?
If bitcoin settles below the trend line support and breaks the $9,070 support, it might struggle to stay above the $9,000 support zone.
A downside break below the $9,000 support may possibly change the trend and the bears are likely to aim a larger decline towards $8,400 or even $8,200 in the near term.
Technical indicators:
Hourly MACD – The MACD is now gaining momentum in the bullish zone.
Hourly RSI (Relative Strength Index) – The RSI for BTC/USD is now well below the 50 level.
Major Support Levels – $9,200 followed by $9,070.
Major Resistance Levels – $9,600, $9,800 and $10,000.


