
On-chain data shows Bitcoin has failed in its latest retest of a historically significant metric, a sign that a bearish trend might have taken over.
Bitcoin Has Been Rejected From The Short-Term Holder Cost Basis
As pointed out by an analyst in a post on X, BTC is currently facing resistance at the short-term holder’s realized price. The “realized price” here refers to the cost basis or acquisition price of the average investor in the Bitcoin market.
When the spot price of the cryptocurrency is below this level, it means that the investors as a whole are currently in a state of net loss. On the other hand, the asset being above this metric suggests that the overall market is holding some profits right now.
In the context of the current discussion, the realized price of the entire BTC sector isn’t of relevance, but of only a particular segment: the “short-term holders” (STHs).
The STHs are the investors who purchased their coins within the past 155 days. The members of this group are generally weak in their conviction, and thus, they can be quite reactive to changes in the market.
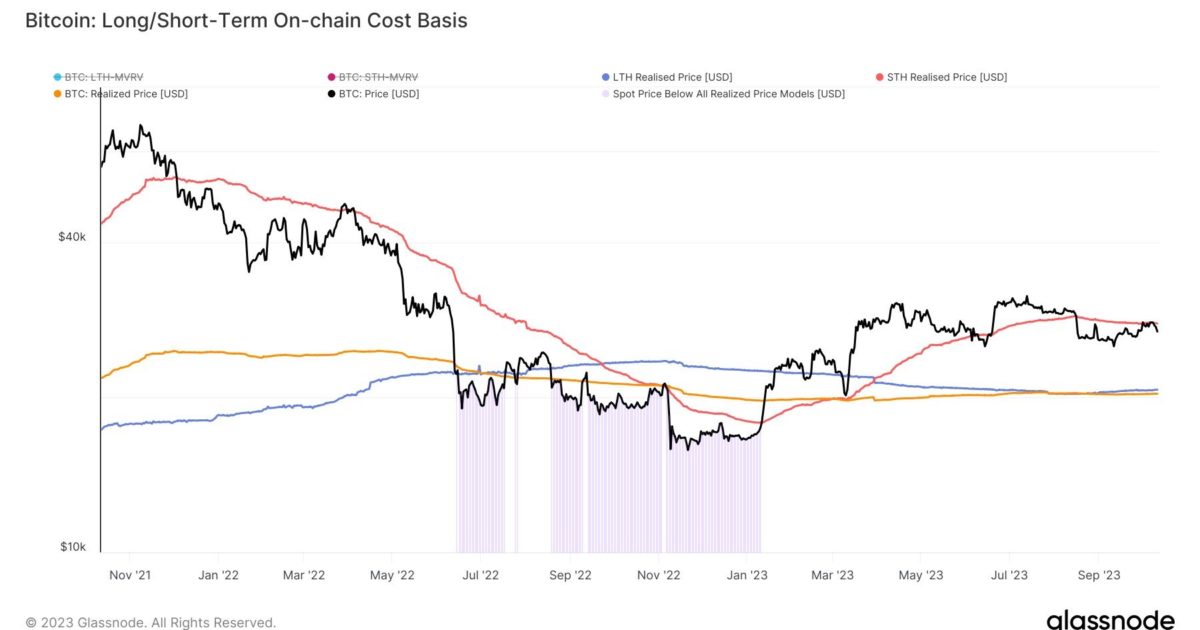
Now, here is a chart that shows the trend in the Bitcoin realized price specifically for these STHs over the past couple of years:
Looks like the asset retested this line just recently | Source: @jimmyvs24 on X
As displayed in the above graph, the Bitcoin short-term holder’s realized price is valued at about $27,800 right now. During its most recent attempt at recovery, BTC retested this line but ended up finding some major resistance at it.
The indicator actually has a lot of history of acting as both resistance and support for the spot price of the cryptocurrency. Generally, this line has helped the asset during bull rallies, while it has impeded it in bear markets.
From the chart, it’s visible that the asset’s price had found resistance at this mark and had remained under it throughout the bear market in 2022. With the rally that started in January of this year, though, the coin had finally managed to find a break.
The realized price of the STHs had then flipped towards being a support level, as it had propelled the asset during the retests in March and June. With the crash in August, however, Bitcoin once again slipped below the line and has been unable to climb back above it since.
Given the significance of the line, the latest retest of the indicator was quite important, so the fact that it ended in failure could be a worrying sign for the asset, as it may mean that a shift back towards a bearish trend might have occurred.
BTC Price
Retests like the one of the STH realized price can sometimes take a while to properly finish, but since Bitcoin has seen a steep decline towards the $26,700 level since the rejection, it may be confirmation that the asset was indeed rejected this time.

The price of the coin seems to have been going down in the last few days | Source: BTCUSD on TradingView
Featured image from Shutterstock.com, charts from TradingView.com, Glassnode.com


