- Bitcoin formed a super bullish Golden Cross on May 20, 2020.
- Nevertheless, the cryptocurrency plunged by up to 9 percent in a contrary move.
- Earlier in February 2020, Bitcoin’s Golden Cross formation had followed a 61 percent price crash.
On May 20, 2020, Bitcoin formed a Golden Cross, a widely-tracked, long-term bullish indicator for classic trend followers.
The pattern surfaced as Bitcoin’s 50-day moving average crossed above its 200-day moving average, marking the first of such formations since February 18 and seventh in the cryptocurrency’s lifetime. Moving averages paint an accurate picture of a price trend by using older data and removing noise created by intraday fluctuations.
Source: Twitter
But buyers didn’t step into the Bitcoin market on Golden Cross-FOMO that left the cryptocurrency vulnerable to a deeper downside correction. From painting the 50-100 DMA crossover until its local bottom yesterday, bitcoin plunged by $913, or circa 9 percent, to $8,800.
Eerie Fractal
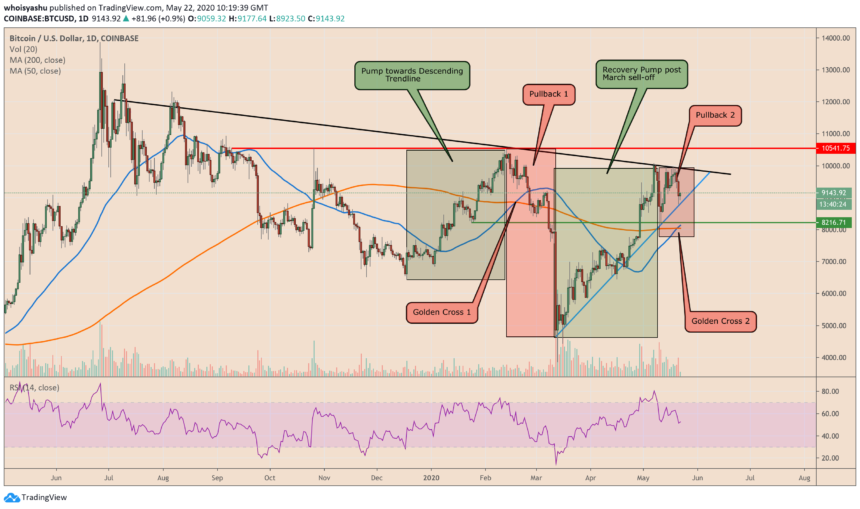
Not a standalone incident, Bitcoin’s immediate pullback after forming the Golden Cross was similar to price moves from February. Back then, the cryptocurrency rallied circa 60 percent, tested its long-term Descending trendline, pulled back, and formed a Golden Cross.
But the bullish pattern did not help bitcoin sustain its rally. The price fell by as much as 61 percent by March 13, 2020.
As shown in the chart above, Bitcoin’s recent price action looked identical to the February fractal. Here also, the cryptocurrency rallied from its bottom below $4,000 to close above $10,000. It then tested the same Descending Trendline for a breakout but failed. Later, the price corrected to the downside while painting a Golden Cross.
While bitcoin was maintaining strong support near $9,000, it now risks completing the Feb fractal with an extended downside correction towards 50-day moving average (blue), followed by a retest of the 200-day moving average. These levels are inside the $8,000-$8,100 price range as of May 22.
Bitcoin Fundamentals
The deeper downside correction in the Feb-March period took cues from worsening macroeconomic health. The rising number of coronavirus cases across the U.S. took a toll on investors’ risk-on sentiment. They dumped assets in almost every market, crashing even the Dow Jones to its lowest since 2008-09 financial crisis.
Traders ended up dumping safe-haven assets, including bitcoin and gold, to cover their losses elsewhere, causing them to slump alongside global stocks. But all the market rebounded almost in tandem after central banks decided to intervene with expensive stimulus packages to contain the financial damage caused by the coronavirus outbreak.
The pandemic hasn’t left or subsided entirely in May 2020. Health experts warn that the second wave of infections could hit China, Europe, and the U.S. – as they plan to reopen economies fully. At the same time, the Federal Reserve has pledged to continue its open-ended stimulus program to aid markets – an ingredient that was missing during the March sell-off.
That may help Bitcoin limit its downside actions below the 50- and 200-DMA.


