

View
- Bitcoin has found acceptance under the three-day chart’s 200-period average for the first time in seven months.
- The breakdown may attract stronger selling pressure, yielding a slide below the November low of $6,500.
- A minor bounce to $6,800 may be seen before a deeper slide, with the intraday charts reporting oversold conditions.
- A UTC close above the Nov. 29 high of $7,870 is needed to confirm a short-term bullish reversal.
Bitcoin risks dropping to seven-month lows below $6,500, having found acceptance under a key long-term price support.
The top cryptocurrency by market value fell by 6.33 percent in the three days to Dec. 17 (data from Bitstamp), erasing almost the entire corrective bounce from $6,500 to $7,870 witnessed in the last week of November.
More importantly, the three-day candle, representing the price action for Dec. 15-17, closed below the 200-period moving average (MA) – a level considered a barometer of the long-term market trend.
That’s the first time the 200 MA has been breached since May. Bitcoin now faces stronger selling pressure and could see a drop below the November low of $6,511.
At press time, bitcoin is changing hands at $6,640 on Bitstamp, representing a 3 percent decline on a 24-hour basis. The three-day 200-period MA is lined up at $6,948.
3-day chart
Bitcoin’s previous three-day candle closed well below the 200-period MA, unlike the hammer candle witnessed in late November, which printed lows below the average support but closed higher.
The latest breakdown of the major support is backed by a bearish below-50 reading on the relative strength index (RSI) and descending 5- and 10-period MAs. Further, the 5- and 200-period MAs look set to produce the first bear cross since October 2018.
The chart also shows that cryptocurrency is trapped in a five-month falling channel, meaning the broader market trend is also bearish.
Thus, the odds appear stacked in favor of a violation at $6,500 (November low). That would expose the next support at $6,378 ( Nov. 3, 2018 high).
It’s worth noting that bitcoin has already retracted 50 percent of the rally from December 2018 lows near $3,100 to the June 2019 high of $13,880.
Daily chart
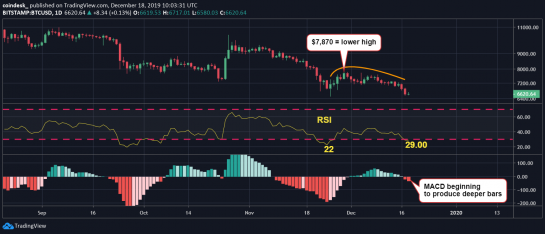
The RSI has dropped below 30, but is holding well above the low of 22 registered in November. Put simply, there’s room for a deeper price slide.
The MACD histogram is beginning to produce deeper bars below the zero line – a sign the downside move is gathering traction.
A UTC close above $7,870 is needed to invalidate the bearish lower highs set up and confirm a short-term bearish-to-bullish trend change.
Hourly and 4-hour charts
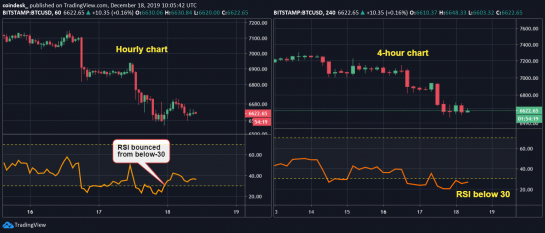
The RSI on the hourly chart has risen from oversold territory, signaling scope for a price bounce. The 4-hour chart RSI is also indicating oversold conditions.
So, a minor corrective rally to resistance at $6,800-$6,948 cannot be ruled out, before the sell-off returns, as suggested by three-day and daily charts.
Disclosure Read More
The leader in blockchain news, CoinDesk is a media outlet that strives for the highest journalistic standards and abides by a strict set of editorial policies. CoinDesk is an independent operating subsidiary of Digital Currency Group, which invests in cryptocurrencies and blockchain startups.


