

Over the last month, Bitcoin dominance has grown by nearly 3%. The climb has largely been driven by the asset’s block reward halving set for less than 24 hours from now.
The latest move in BTC dominance has left altcoins on the ropes, and exposing them to a bounce or die scenario. The apex of a multi-year triangle is nearing a resolution, and which way it breaks will determine the future of the alternative crypto assets. Is this the asset’s make it or break it moment?
Bitcoin Dominance Forms Multi-Year Triangle, Price Action Reaches Apex
BTC dominance is a metric used to weigh the first-ever cryptocurrency against the rest of the market.
Increases in the market caps of altcoins such as Ethereum, Ripple, or Chainlink lower Bitcoin’s dominance over the rest of the space.
Related Reading | This Altcoin’s Fractal Shows How Epic the Next Crypto Bull Market Can Be
Just like price charts of individual assets, BTC dominance ebbs and flows just like anything else. During altcoin seasons, BTC dominance takes a dive. However, when things get especially bullish for Bitcoin, altcoins often suffer as a result.
Take last year’s bull run for example. Altcoins had performed strongly aside Bitcoin, until around May 2019 and then Bitcoin left them in its dust.
Alts crashed, and Bitcoin set a local high. BTC dominance reached a high of 73% before reversing.
Bitcoin is once again performing, and its halving is tomorrow. The bullish event could lead Bitcoin to break free from a separate long-term triangle on the BTCUSD pair. This would also cause a corresponding break of the triangle on BTC.D charts.
And with the most recent price action leaning heavily bullish towards Bitcoin, altcoins could see a major collapse.
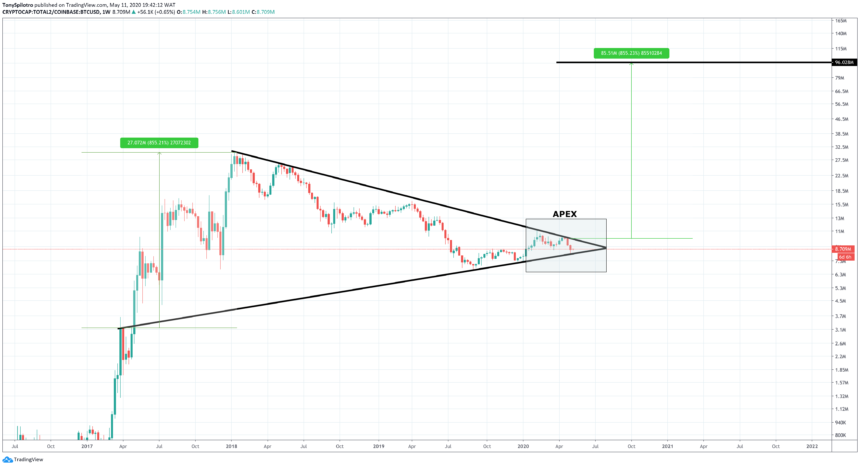
BTC Dominance: Will Altcoins Skyrocket Again, or Will They Be Annihilated
In the above chart, the total altcoin market cap can be seen as a trading pair against BTC. The chart essentially acts as the inverse of a BTC.D chart.
A breakdown of the multi-year triangle could result in complete destruction to altcoins that are already down over 99% in many cases.
Related Reading | Bitcoin Dominance Climbs, Leaving Altcoins Vulnerable to New Leg Down
However, symmetrical triangles also can break up. With the prior trend being bullish for altcoins, continuation to the upside is very likely.
Clearly, given the circumstances, altcoins are at a bounce or die junction that will shape the future of the asset class.
Bitcoin’s halving is tomorrow, and the asset is expected to explode into its next bull market as a result. But it was the last halving that kickstarted the alt season that sent the assets to their all-time highs.
In the below BTC.D chart, each halving has been highlighted with a red dotted line.
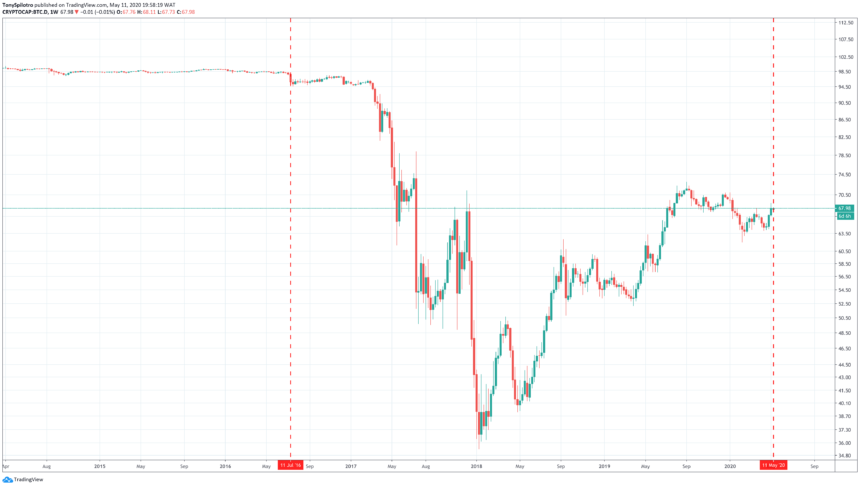
The 2016 halving is what sent altcoins into the stratosphere, causing BTC.D to dip from a then-high of 98% to as low as 35% as the crypto bubble of 2017 peaked.
Is the cycle restarting once again with the halving, or will Bitcoin‘s bull run crush altcoins once again?


