

Bitcoin is slowly moving higher and trading above the $9,100 level against the US Dollar. BTC could start a strong upward move if it clears the $9,300 and $9,340 resistance levels.
- Bitcoin is showing a few positive signs above the $9,000 and $9,100 levels.
- The price is trading above the 100 hourly simple moving average, but it is still well below $9,300.
- There was a break above a crucial bearish trend line with resistance near $9,170 on the hourly chart of the BTC/USD pair (data feed from Kraken).
- The pair is lacking bullish momentum and it could dive again unless it breaks the $9,300 resistance.
Bitcoin Price is Showing Recovery Signs
Yesterday, bitcoin started a decent recovery wave from the $8,813 swing low against the US Dollar. BTC climbed above the $9,000 pivot level to move into a short term positive zone.
The recovery wave such that the price was able to settle above $9,100 and the 100 hourly simple moving average. Moreover, there was a break above a crucial bearish trend line with resistance near $9,170 on the hourly chart of the BTC/USD pair.
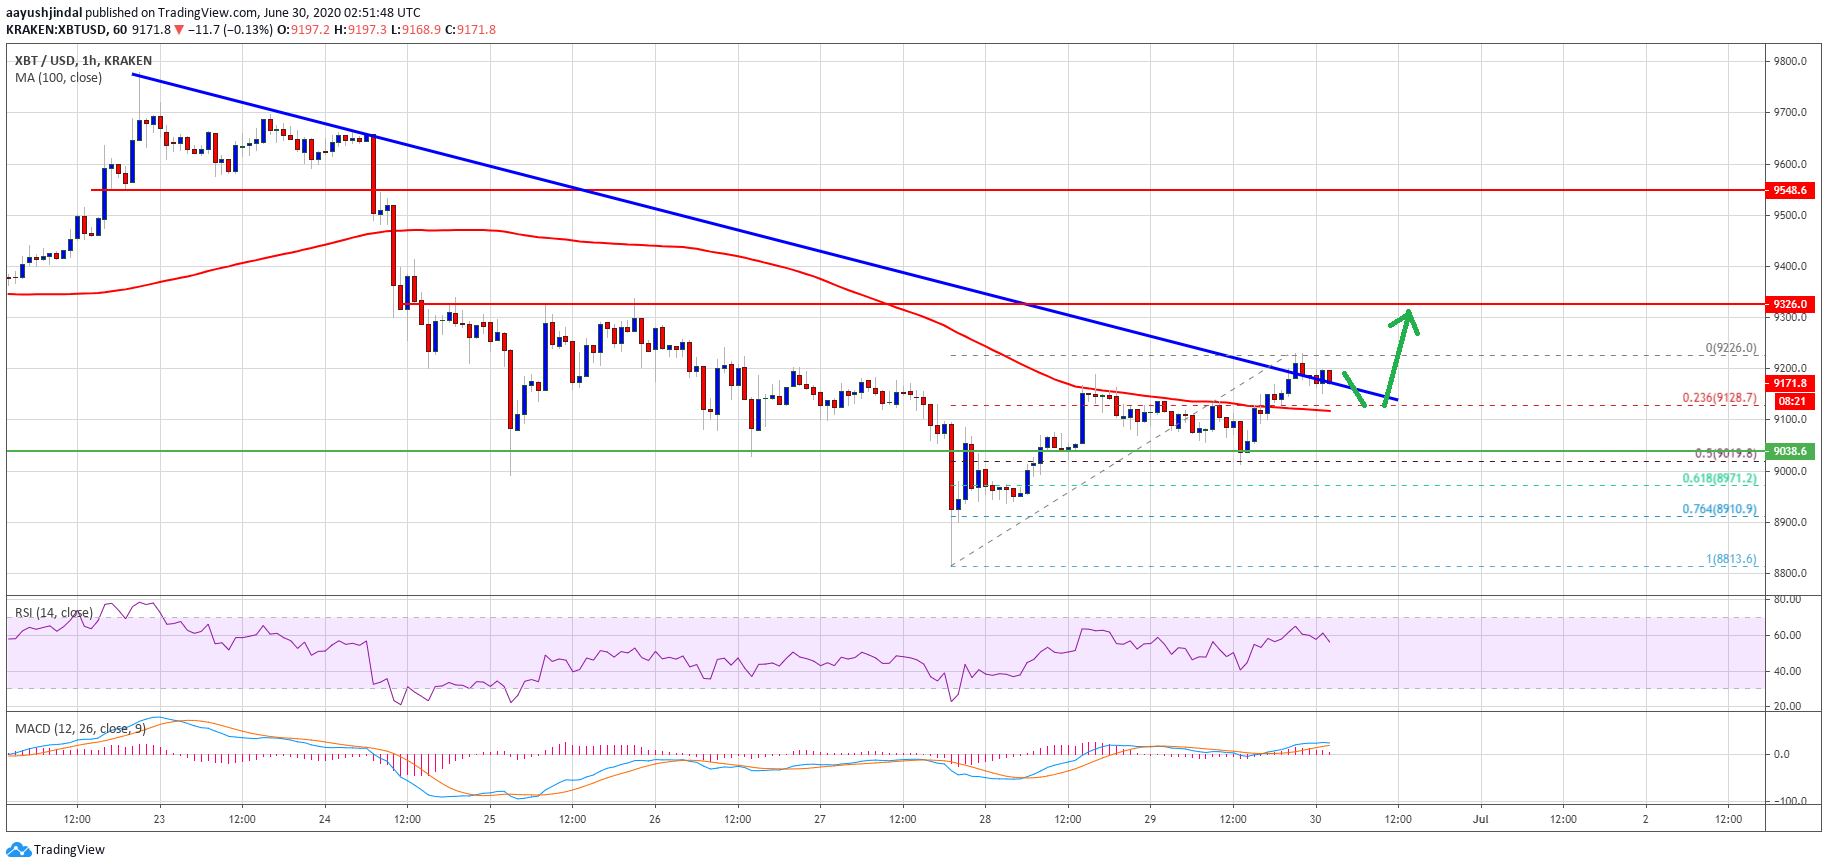
However, the price is lacking momentum above the $9,200 resistance level. It is currently consolidating near the broken trend line at $9,170. An initial support is near the 23.6% Fib retracement level of the upward move from the $8,813 low to $9,226 high.
Bitcoin price breaks $9,200: Source: TradingView.com
The main support is now forming near the $9,000 level and the 100 hourly simple moving average. It is close to the 50% Fib retracement level of the upward move from the $8,813 low to $9,226 high.
On the upside, the price must surpass the main $9,300 and $9,340 resistance levels to move into a positive zone. If the bulls succeed, there could be a sharp upward move towards the $9,500 and $9,550 resistance levels.
Bearish Reaction in BTC?
If bitcoin struggles to continue higher above $9,200 or $9,300, there is a risk of a bearish reaction. On the downside, the $9,000 support and the 100 hourly SMA hold the key.
A successful close below the $9,000 support level could negate the chances of an upside break. In the stated case, the price will most likely resume its decline towards $8,800 or even $8,650 in the coming sessions.
Technical indicators:
Hourly MACD – The MACD is struggling to gain pace in the bullish zone.
Hourly RSI (Relative Strength Index) – The RSI for BTC/USD is correcting lower towards the 50 level.
Major Support Levels – $9,100, followed by $9,000.
Major Resistance Levels – $9,220, $9,300 and $9,340.


