

There are three altcoins to watch this and next week, as I am expecting high volume injections during weekends, my top picks are ADA/USD, LINK/USD, ZIL/USD.
The sell-off ahead of the FOMC meetings has stopped today after claims made by the Chairman Mr. Powell. Mr. Powell has stated that the date of the economic recovery still remains uncertain and strictly dependent on the virus spread and vaccination advances. The US Dollar gained significantly yesterday adding 0.53% to its value hitting the 90.880 benchmark. The US Dollar rally caused some cryptocurrencies to fall into a correction, hence Bitcoin lost 6.47%, Ethereum 9.29% yesterday, though both were able to rebound today.
Cardano
Cardano is one of the top gainers this year gaining nearly 84% this year only and hitting a new all-time-high at $0.397412. As many analysts and cryptocurrency researchers suggest that the DeFi boom this year will be greater and make a greater noise, Cardano with its Shelley upgrade and DeFi transition is surely one of the altcoins to watch.
ADA/USD has formed a triangle, and is still in an uptrend channel. With sellers puch the price lower and buyers pushing the price higher, the pair could go either way, although continuation of the uptrend is most likely. The uptrend continuation is backed by MACD and RSI indicators. The MACD line is very close to crossing the signal line, however EMA50 and MA100 are strong resistances.
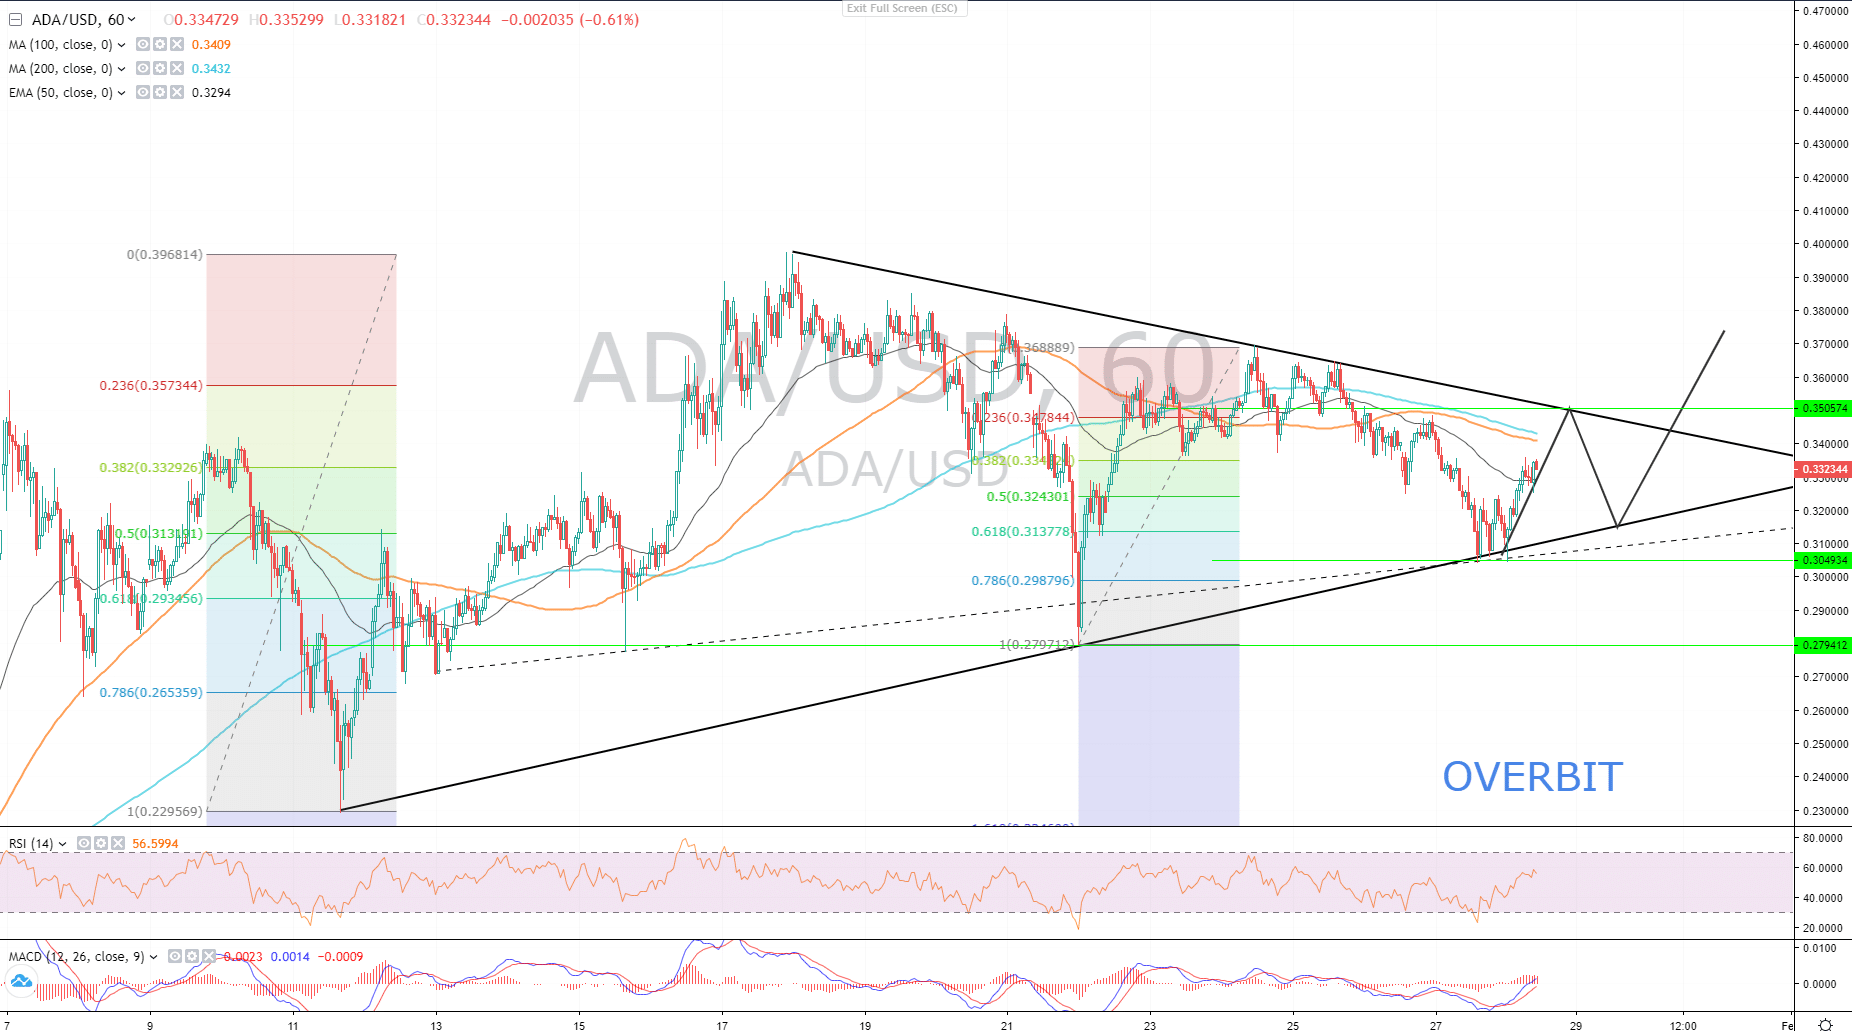
The triangle pattern usually signals the ABCDE correction based on the Elliott Wave theory and is a trend continuation pattern. However, to make sure that the price action follows the rules of Elliott waves, it is highly recommended to use Fibonacci retracement tool. As seen on the chart above, previous retraces of the uptrend ended near the 0.786 Fibo, which means that the bearish trend is not yet confirmed and that buyers need a deeper correction to regain their purchasing power.
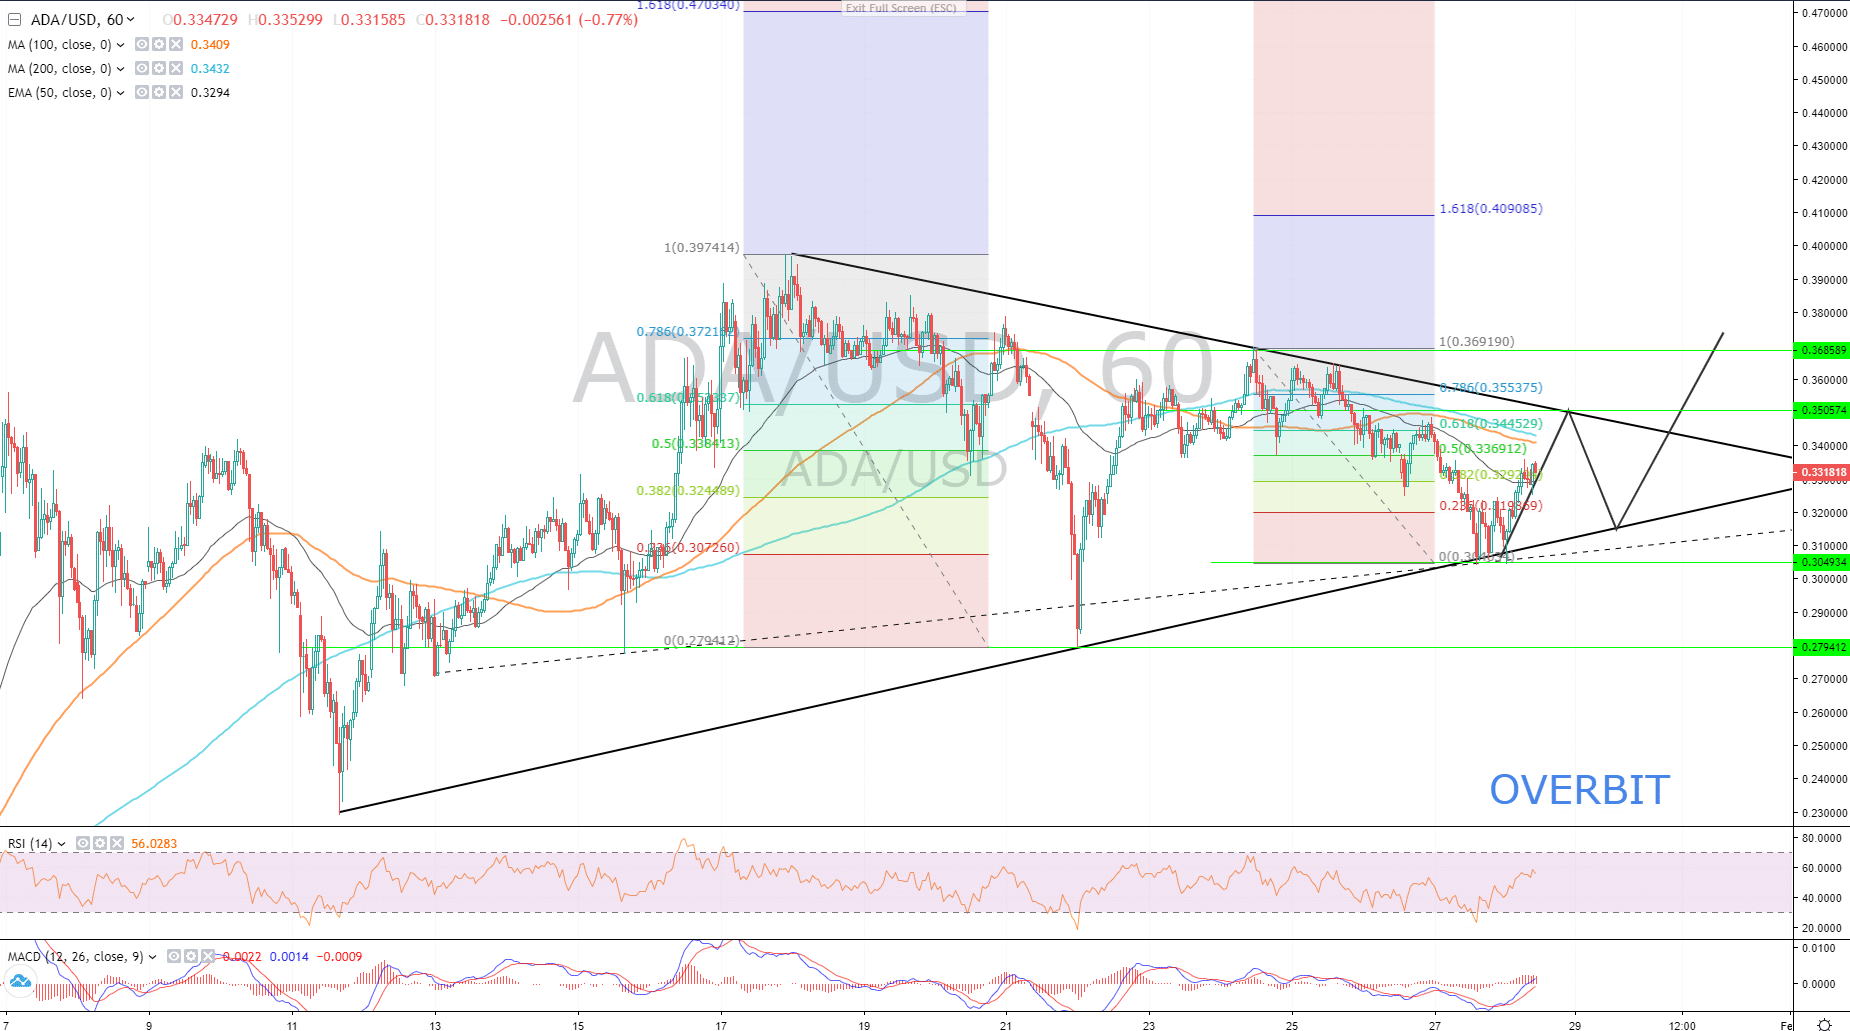
The same is spotted on the reversed trend, each uptrend of the previous correction ends at 0.786 Fibo, means that sellers too look for the best price to sell and are acting rather confident rather than cautious. For this pair, watch the $0.350500 level very closely as it’s a Fibo 0.786 level and the upper edge of the triangle. After the testing of the upper edge, it’s expected that the pair will go down once again to complete the wave E and breakout from the triangle. When the triangle breakout is confirmed watch for resistances at $0.368600 – $0.374000.
Zilliqa
Zilliqa is an example of a great project with great scalability, according to Zilliqa’s own research, the token price YTD as per January 2021 has grown 760%. And let’s take a look at the chart to see what the ZIL/USD is about to offer.
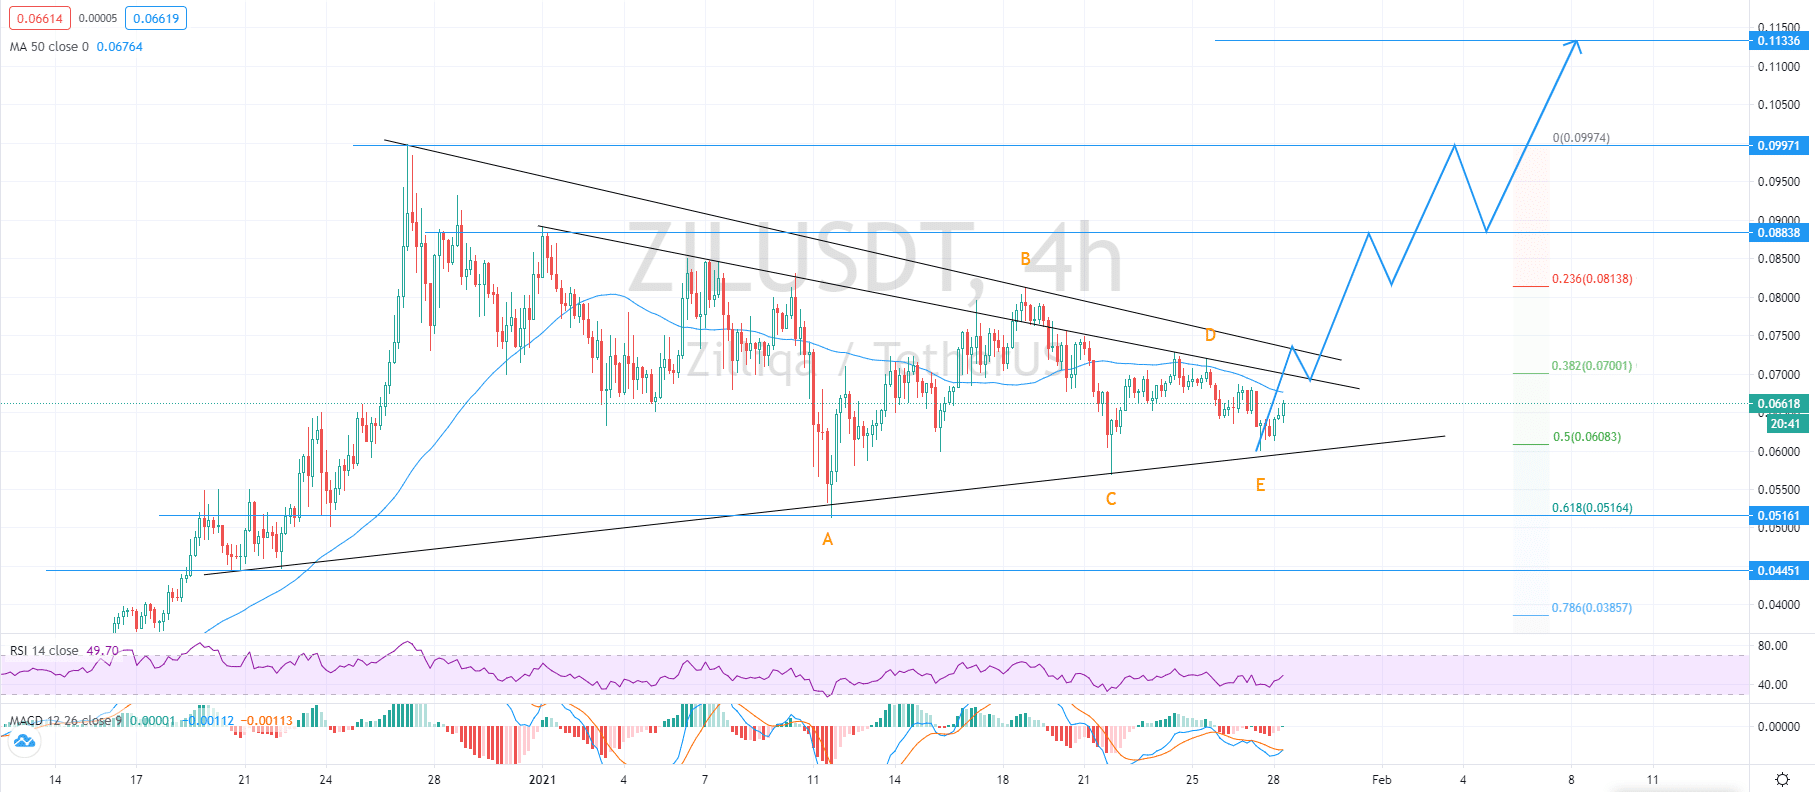
ZIL/USD chart by TradingView.
As seen on the chart above, Zilliqa is in a triangle, the same pattern as on Cardano, although Zilliqa already completed the E wave of the 5-wave corrective pattern. The projection of the uptrend is theoretical and is based on the price action past the resistances. MACD and RSI signal the bullish move, if Zilliqa closes above the upper edge of the triangle, expect a bullish run towards $0.8800 and towards $0.11330 if it breaks the previous high of $0.9971.
Chainlink
Whenever there is any progress in blockchain and DeFi, Chainlink is the project that comes along. With its unique technology and a top-notch chain network, Chainlink is able to interconnect not only blockchains but connect external data to a blockchain. In the year of DeFi and neo-banks and crypto-banks, Chainlinks use is inevitable.
By the time writing of this article, Chainlink is traded at $24.45, and is above the important resistance of $23.60. Today’s impulse is very strong and the resistance ahead at $25.40 will be overtaken after a possible correction down to $23.60 to test this resistance as support and regain power.
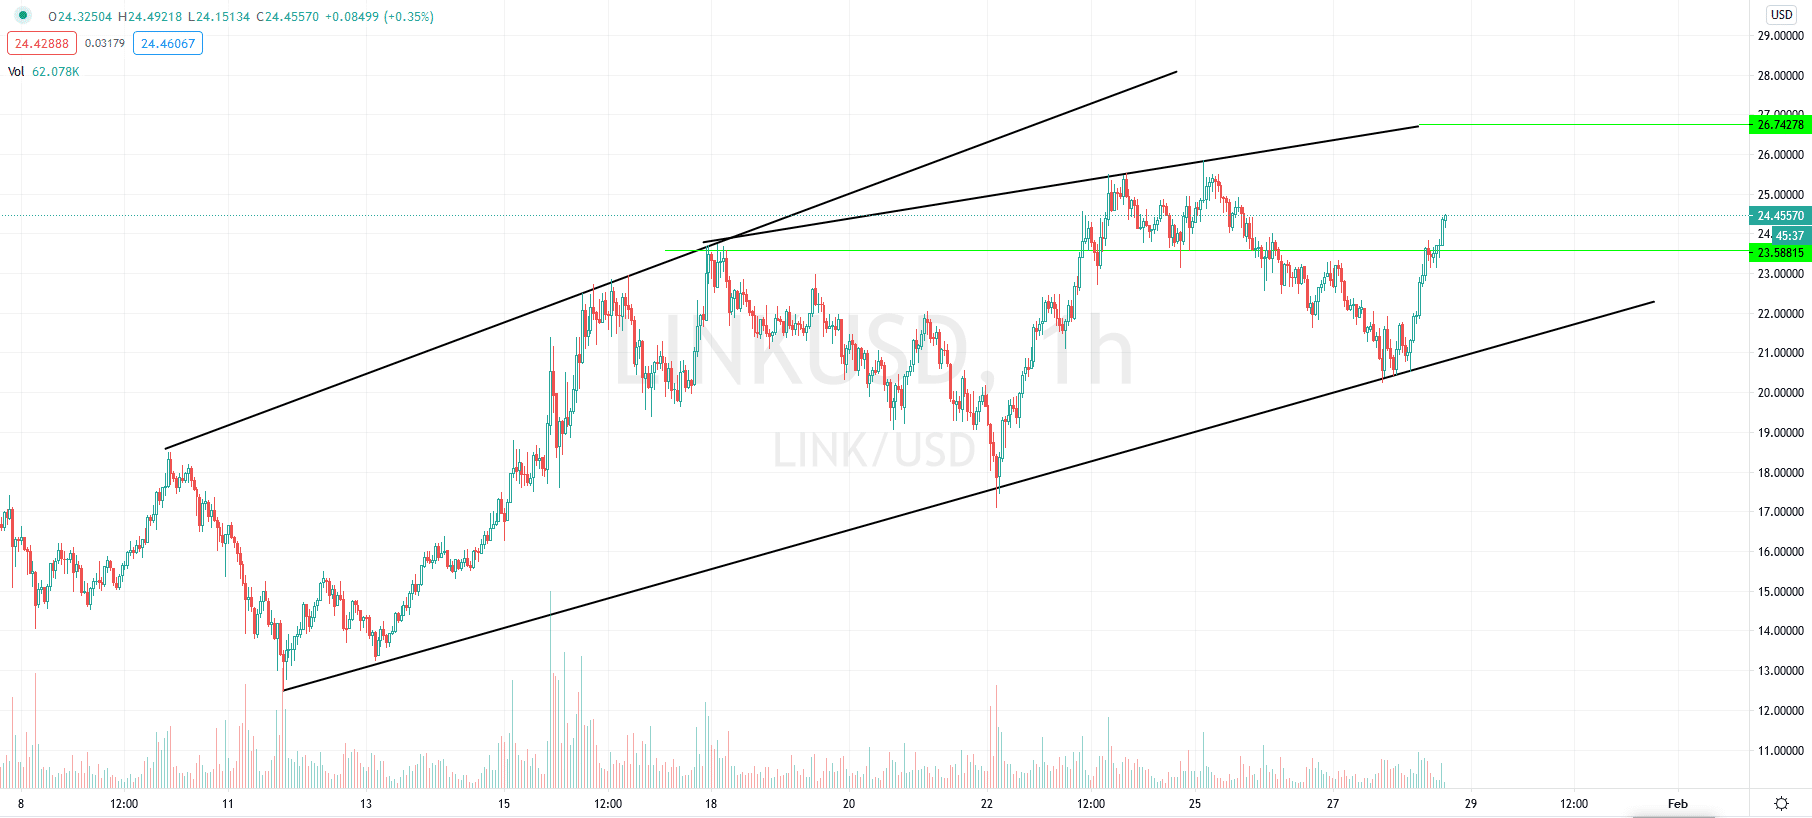
LINK/USD chart by TradingView.
Levels to watch are $25.50 and if the token closes above that level, the next stop would be levels near $26.74 and $27. MACD remains bullish and RSI is already showing the outperformance of the pair, which means that there is a possible correction coming.
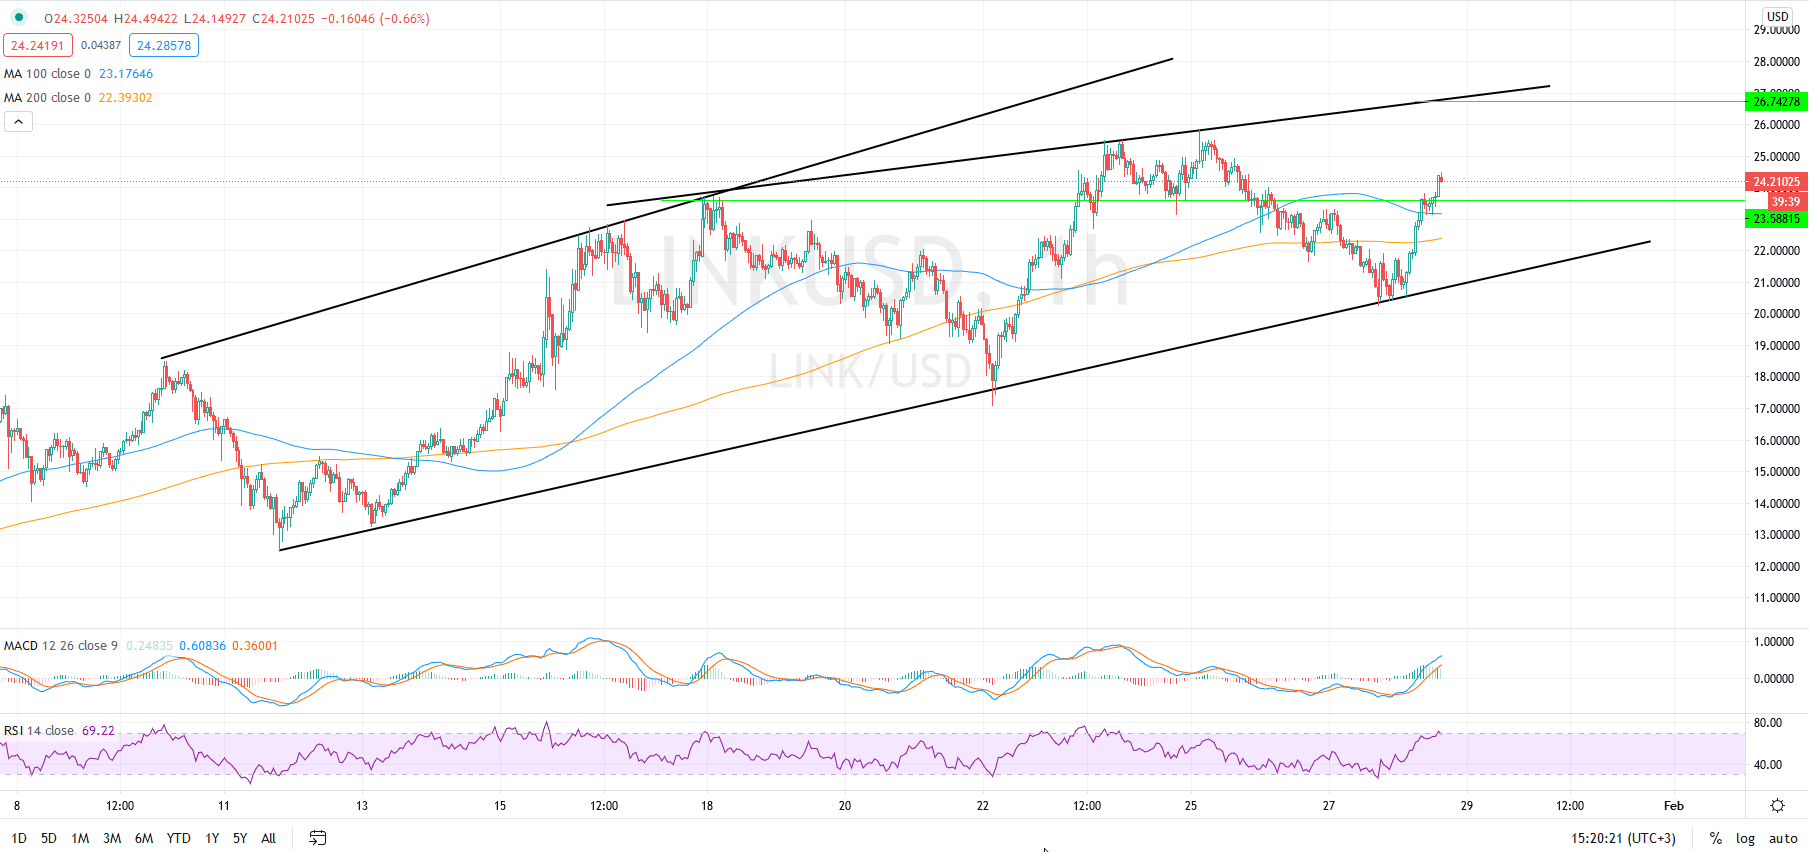
LINK/USD chart by TradingView.
There is a great support of the uptrend by MA100, hence the advancement inside this ending diagonal is most likely to continue.

Senior Vice President at Overbit. Technical analyst, crypto-enthusiast, ex-VP at TradingView, medium and long-term trader, trades and analyses FX, Crypto and Commodities markets.


 Coalition")