

Cardano’s price started a fresh decline below $0.264. ADA is struggling and might accelerate lower if there is a close below the $0.250 support.
- ADA price is gaining bearish momentum below the $0.265 level against the US dollar.
- The price is trading above $0.250 and the 100 simple moving average (4 hours).
- There was a break below a key bullish trend line with support near $0.258 on the 4-hour chart of the ADA/USD pair (data source from Kraken).
- The pair must stay above the $0.250 support to start a fresh increase in the near term.
Cardano Price Trims Gains
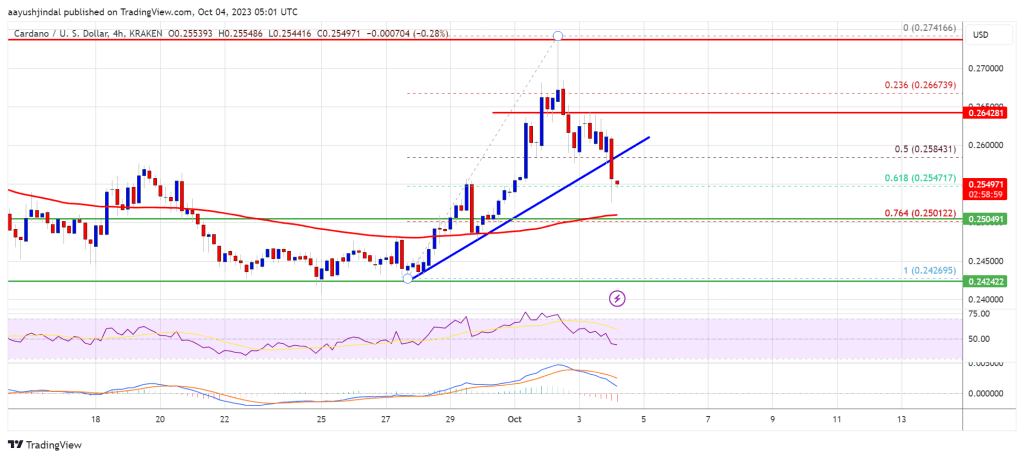
In the past few days, Cardano’s price climbed higher above the $0.255 level. The price was able to clear the $0.265 resistance, but the upsides were limited. The price traded as high as $0.2741 and recently corrected lower, like Bitcoin and Ethereum.
There was a drop below the $0.265 support level. Besides, there was a break below a key bullish trend line with support near $0.258 on the 4-hour chart of the ADA/USD pair.
Cardano is now testing the 61.8% Fib retracement level of the upward move from the $0.2426 swing low to the $0.2741 high. However, ADA is still above $0.250 and the 100 simple moving average (4 hours).
Source: ADAUSD on TradingView.com
On the upside, immediate resistance is near the $0.258 zone. The first major resistance is forming near the $0.265 zone. The next key resistance might be $0.274. If there is a close above the $0.274 resistance, the price could start a decent increase. In the stated case, the price could rise toward the $0.300 resistance zone.
More Losses in ADA?
If Cardano’s price fails to climb above the $0.265 resistance level, it could continue to move down. Immediate support on the downside is near the $0.250 level.
The next major support is near the $0.242 level. A downside break below the $0.242 level could open the doors for a sharp fresh decline toward $0.220. The next major support is near the $0.200 level.
Technical Indicators
4 hours MACD – The MACD for ADA/USD is gaining momentum in the bearish zone.
4 hours RSI (Relative Strength Index) – The RSI for ADA/USD is now below the 50 level.
Major Support Levels – $0.250, $0.242, and $0.220.
Major Resistance Levels – $0.265, $0.274, and $0.300.


 Shares Drop 7% as Cloud Business Misses Estimates in Q3 2023")