

- There is a 57 percent chance of Bitcoin undergoing a bearish breakout, according to a standalone indicator.
- The warning pops at a time when the cryptocurrency is testing a 2.5-year-old trendline as its primary resistance.
- If valid, then the bitcoin price can fall towards $7,700.
Bitcoin has confirmed the presence of a standalone technical indicator that could send its price down to $7,700.
Dubbed as Diamond Top, the fractal pattern appears when an asset forms “higher peaks and lowers valleys,” eventually trapping the price action in a diamond-shaped area. Discovered first by prominent technical analyst Tom Bulkowski, the indicator is slightly bearish, for its occurrence leads the assets to fall 57 percent of the time.
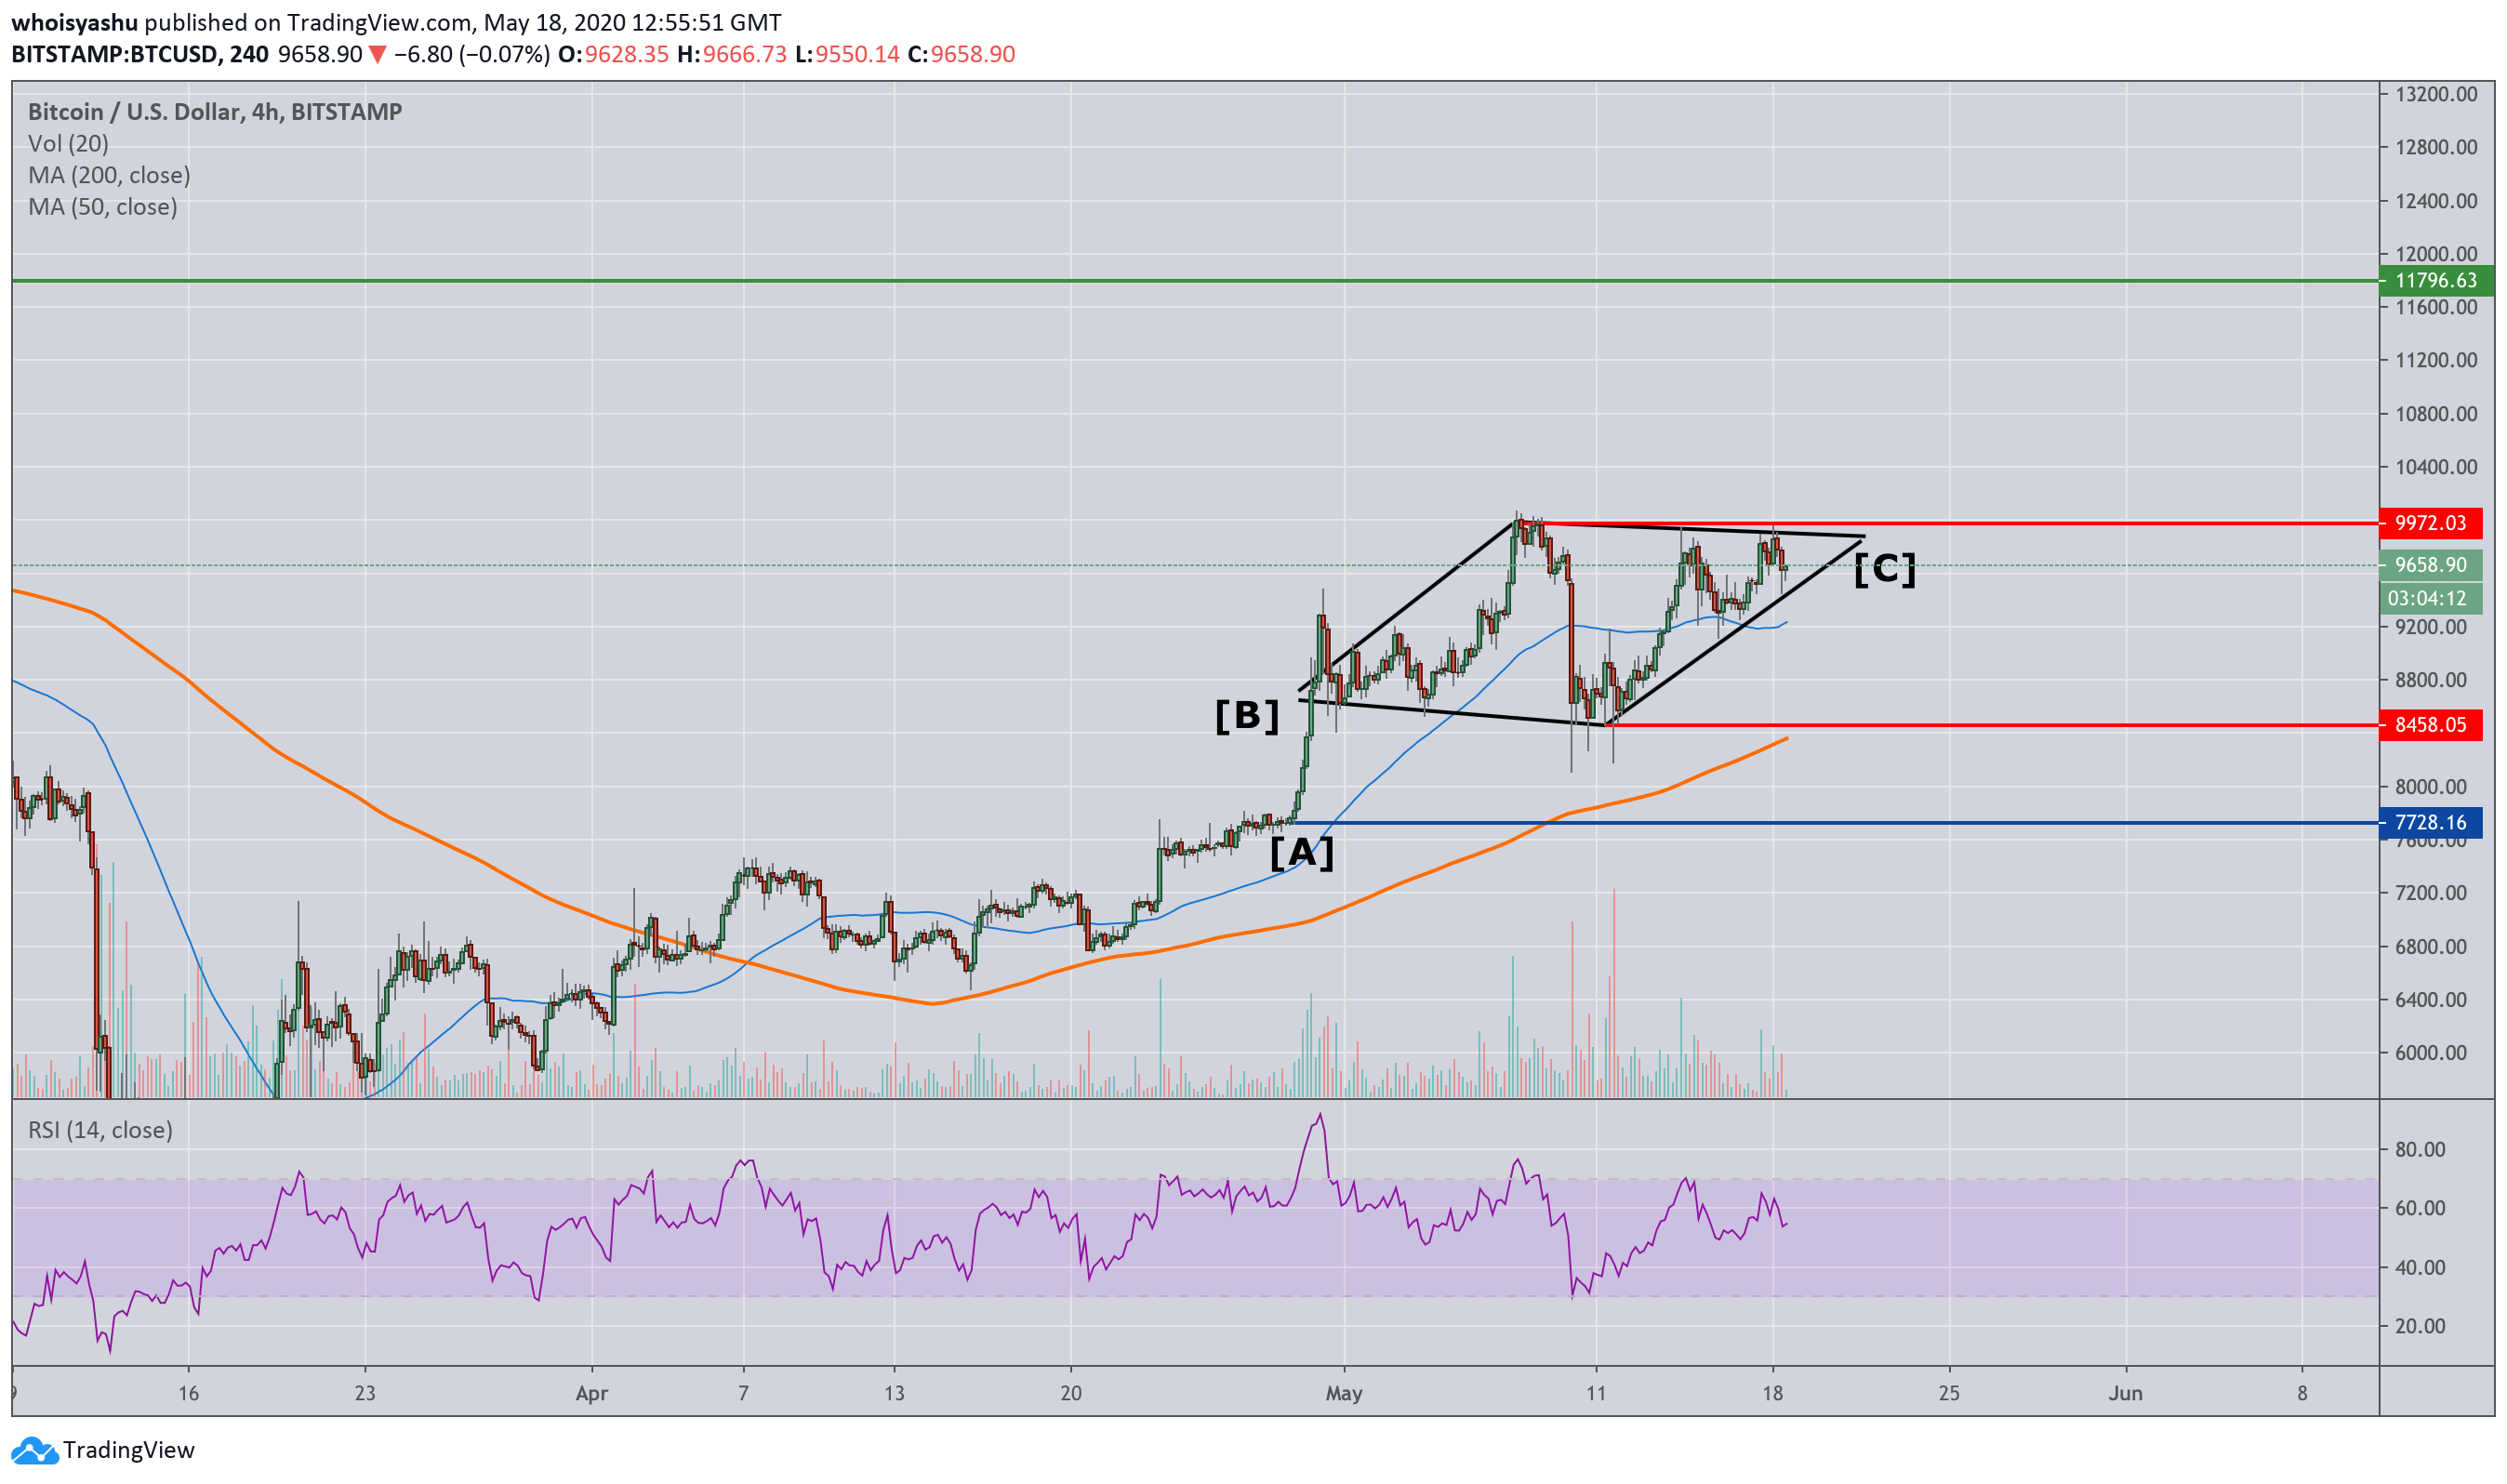
A textbook description of the Diamond Top article highlights successive formations of these characteristics: Uptrend, Shaping, Higher Peaks Lower Valleys, Touches, and Breakout.
Pitting them against Bitcoin’s current price movements paints a similar scenario.
The cryptocurrency was trending upwards (point A to B); it formed the diamond shape (B to C), it touched each trendline at least twice and is now looking to undergo a breakout. 57 percent chance that the next move is to the downside.
Another Resistance
The Diamond Top breakout point is at C, as shown in the chart above. The juncture coincides with a 2.5-year-old Descending Trendline resistance that has capped Bitcoin from extending its upside moves. The cryptocurrency’s seven latest pullbacks occurred owing to the same price ceiling.
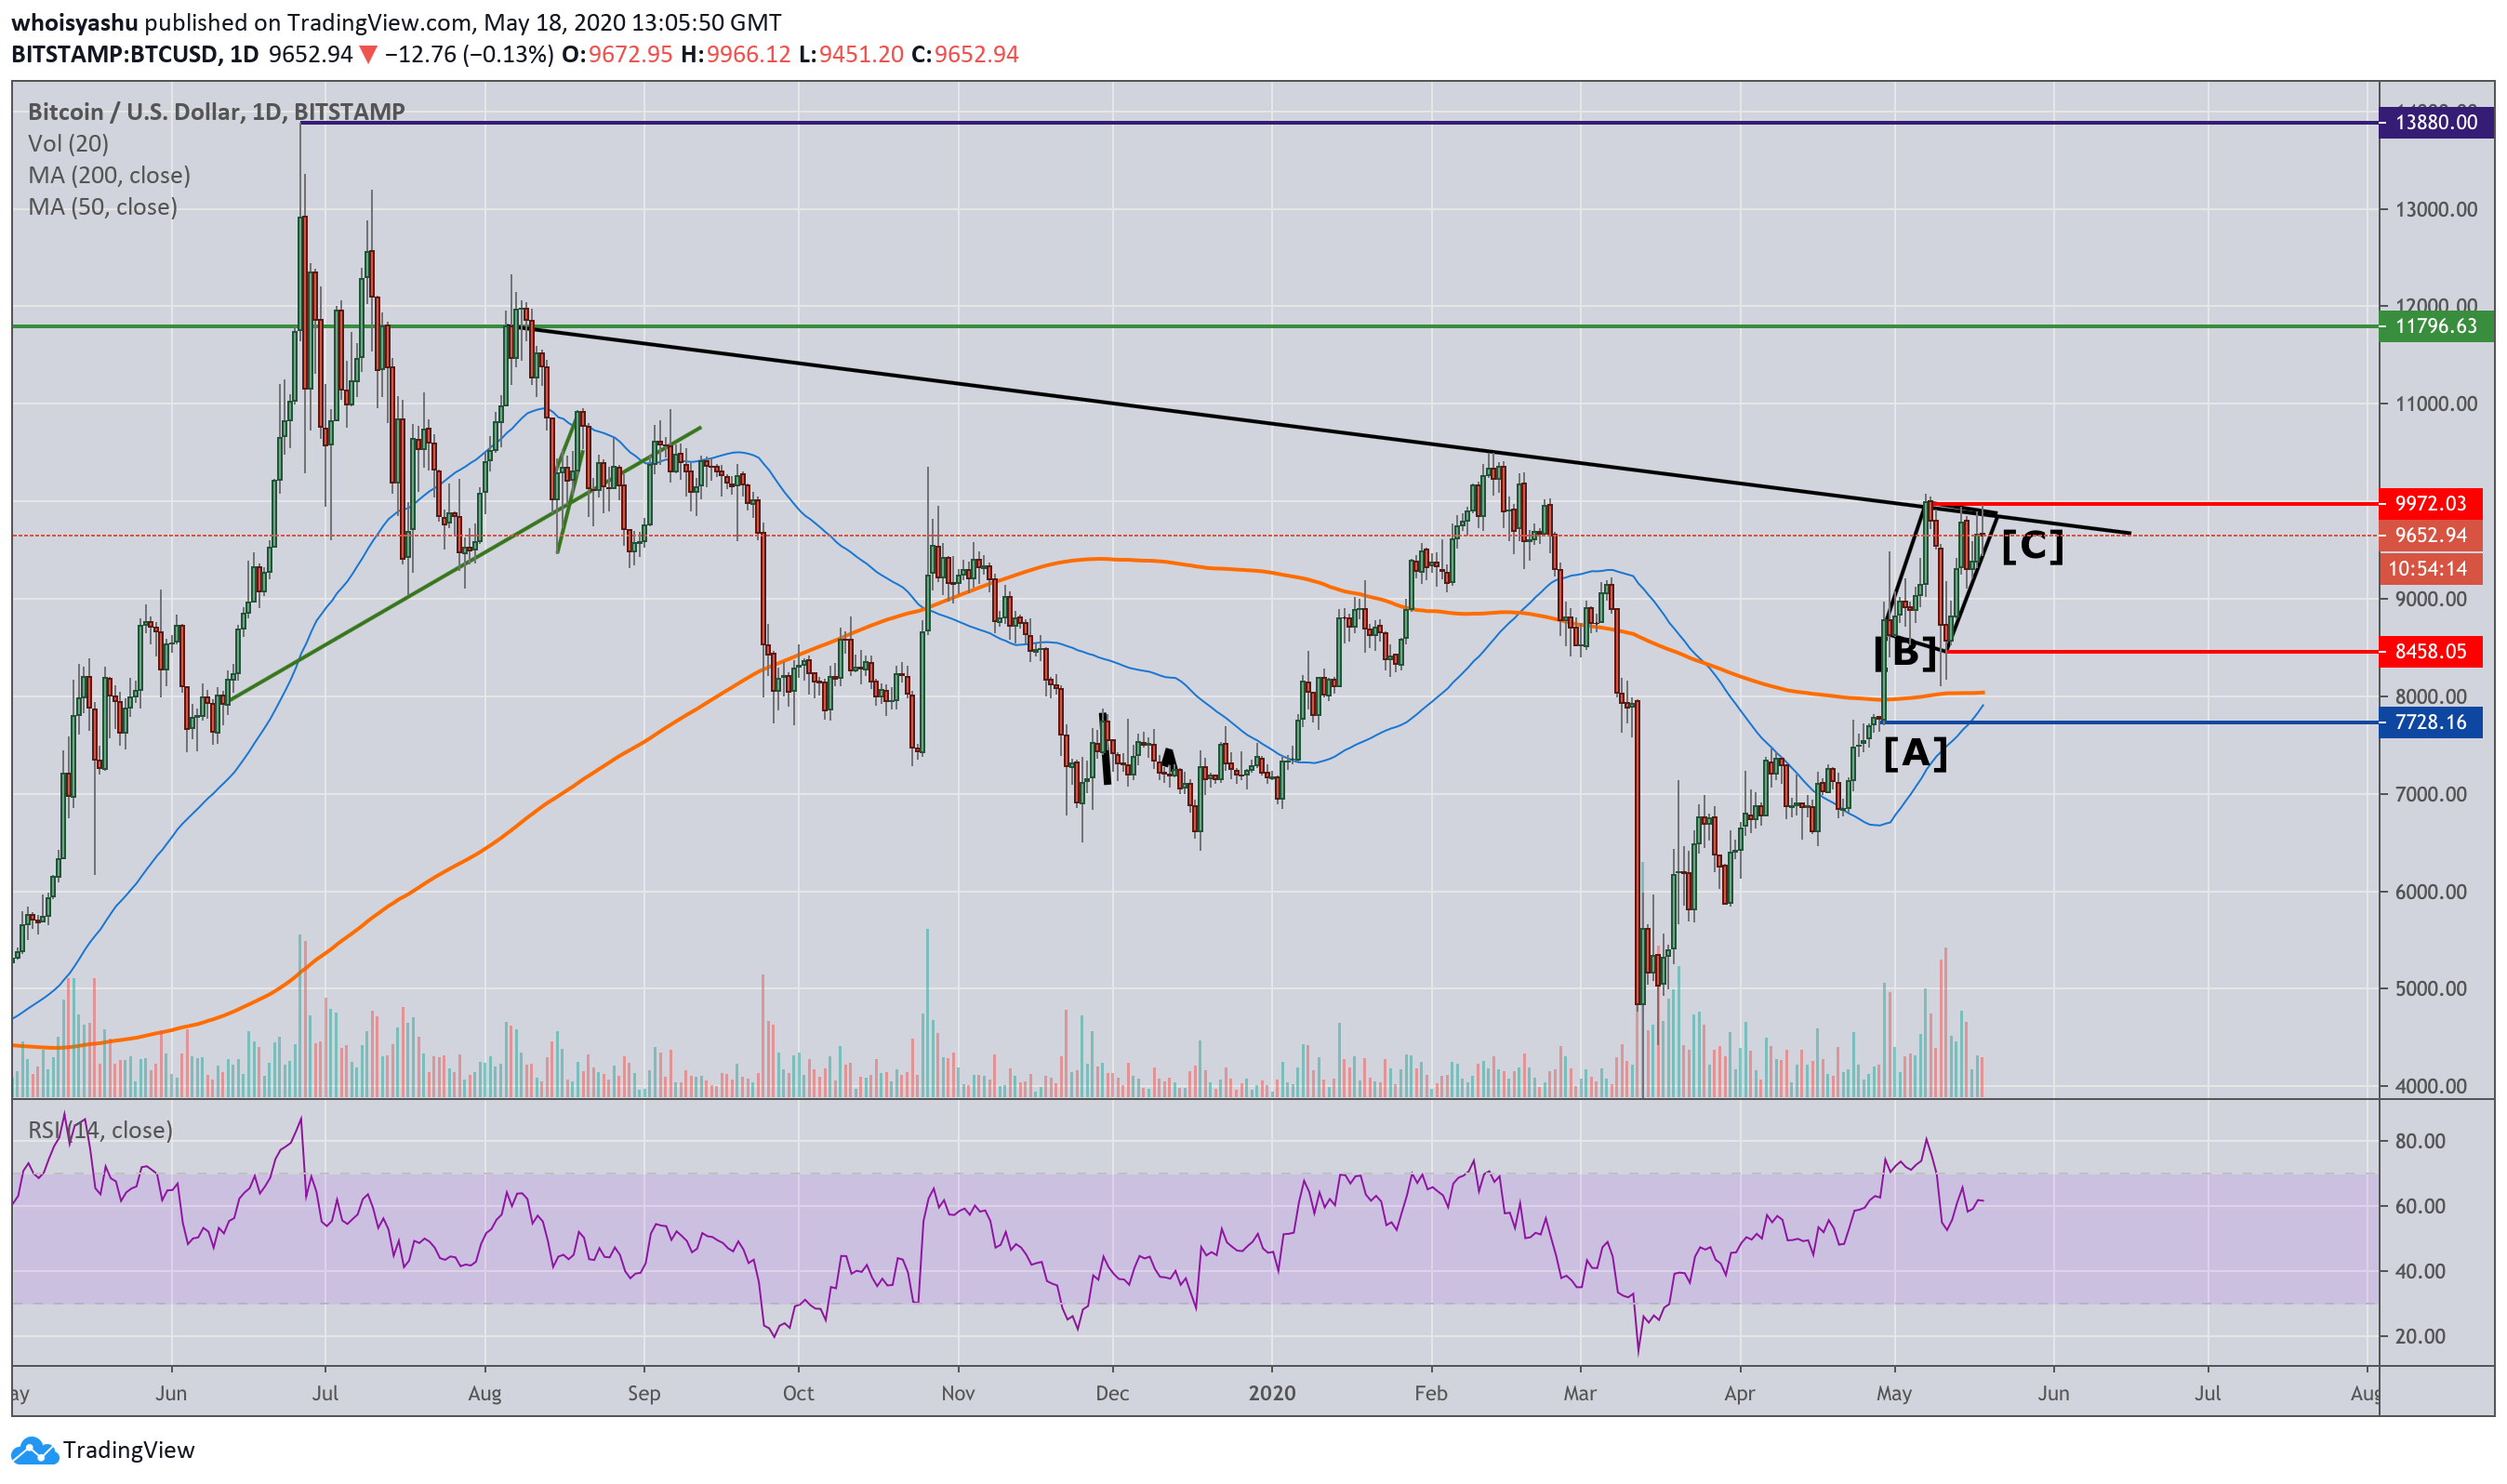
BTCUSD test long-term Descending Trendline as resistance | Source: TradingView.com, BitStamp
The Descending Trendline resistance theoretically validates the breakout that could appear out of the Diamond Top pattern. The selling pressure near the confluence would be higher, leading to price falling back to retest its 200-day moving average (orange).
Coincidentally, the support wave also falls near the Diamond Top’s breakout target.
Bitcoin Price Target
Bulkowski states that “the crash site (downtrend end)” following the Diamond Top breakout is “often near the price level of the launch site (uptrend start).”
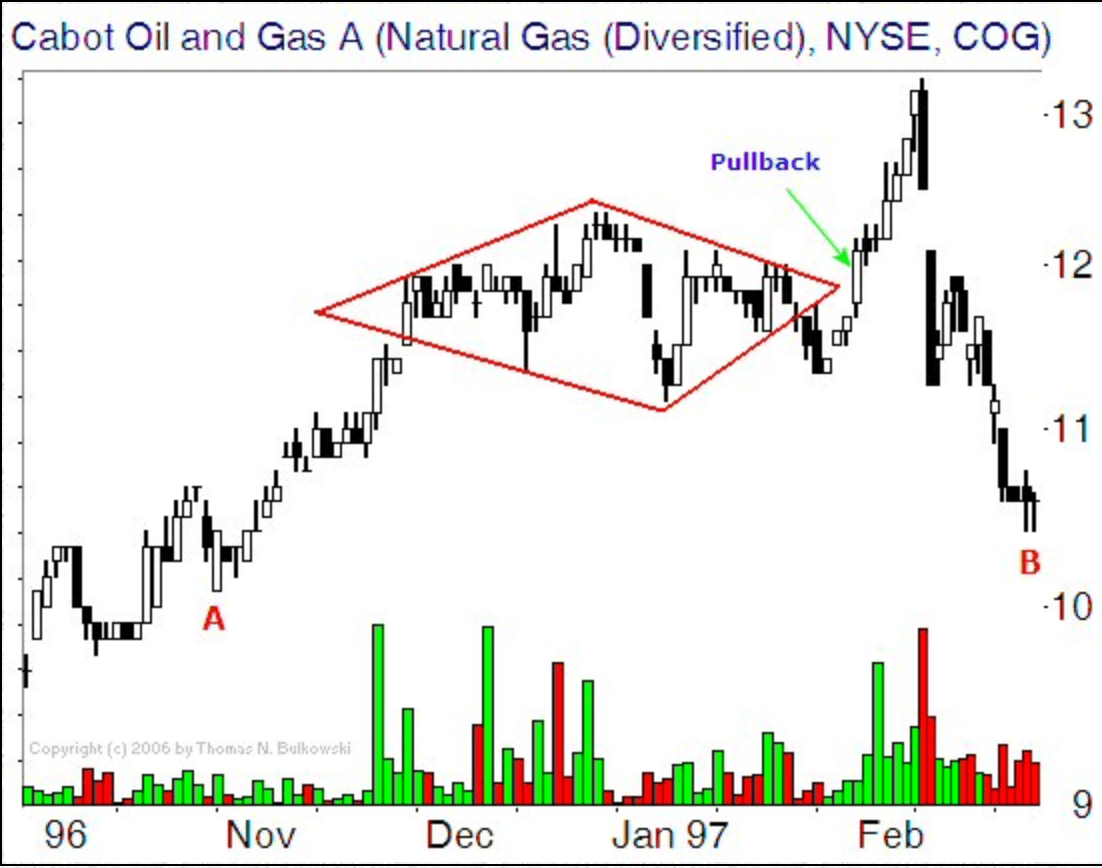
Diamond Top example | Source: The Pattern Site
That said, bitcoin risks falling back towards point A after its breakout. The said downside target is slightly above $7,700 – the same level offered support to Bitcoin’s downtrends in September 2019, October 2019, January 2020, and March 2020.
Meanwhile, there is still a 43 percent chance of Bitcoin rejecting bears. Should that happen, the cryptocurrency would rise by as much as the height of the Diamond Top. That puts its upside breakout target near $11,800.
Photo by Joanna Nix on Unsplash


