XRP, like other major crypto assets Bitcoin and Ethereum, suffered a powerful collapse this week that turned sentiment from extreme greed to fear in a snap.
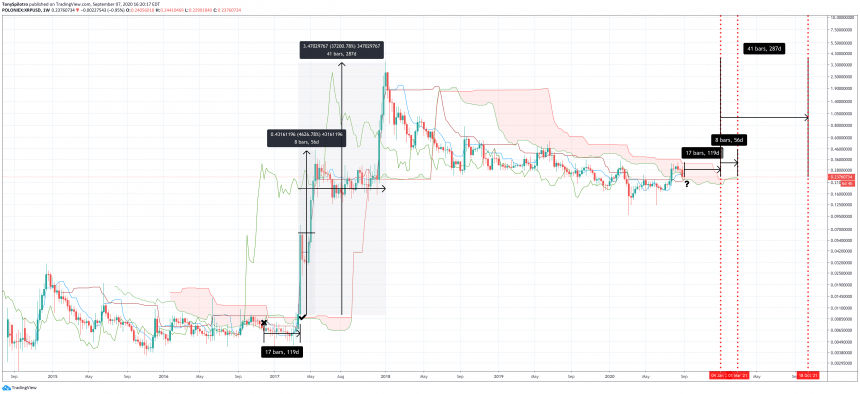
The altcoin called Ripple fell by over 30% from the 2020 high to the local low before rebounding. The fall also took the price per token to the very bottom of weekly Kumo support on the Ichimoku indicator – a potentially bullish signal that in the past led to all-time highs. Losing the cloud, however, could signal stormy days ahead for Ripple price.
XRP Falls 30% From 2020 Highs But Holds Strong At Bottom Of Cloud Support
Last week, after the crypto market reached a staggering 80% year-to-date ROI, the rug was pulled, and valuations began tumbling back down from 2020 highs.
From the peak price of 33 cents per XRP to a local low of 22 per token, represents a 30% fall within just three weeks. The abrupt and severe crash sent sentiment shifting toward fear, but not quite yet to the pandemic panic levels of Black Thursday.
Related Reading | XRP Plunges 20% From Highs: Here’s Why More Downside Is Expected
After an over 200% rally from 2020 lows, any correction may have simply been profit-taking and is nothing more than a healthy correction. It’s just due to how fast it happened that has crypto investors shaken.
Analysts are calling the recent crypto market price action a bullish retest of resistance turned support. And according to the Ichimoku indicator, that is exactly the case for XRPUSD.
Ripple Weekly Price Chart Ichimoku Cloud Support | Source: TradingView
Ripple Effect: Losing Kumo In Past Caused 60% Crash, Recovering It Over 30,000% ROI
The top altcoin behind Ethereum may have fallen, but it is being held up by the one week cloud on the Ichimoku indicator.
The cloud or Kumo highlights where potential support and resistance levels may lie, among other signals. It also expands and contracts based on volatility, and twists from green to red when a bearish reversal is coming and vice versa.
Related Reading | Five Signs Bitcoin Dominance Has Bottomed: Are Altcoins Headed To Zero?
XRP holding above the bottom of weekly cloud support is bullish until the level is lost. Past Ripple price cycles may shed some light on what to expect in the coming days. In the past, the altcoin eventually lost the key level.
120 days later, it reclaimed it and went on an over 30,000% rally to its all-time high record. In less than 60 days alone, Ripple had rallied over 4,000%.
Although there’s a happy ending to this story, the crypto asset suffered an enormous plunge after losing the cloud support. If the same happens again, XRP is in for some stormy cays ahead. The cryptocurrency crashed 60% after losing the bottom support of the Kumo in 2016.
Ripple Weekly Price Chart Ichimoku Cloud Support Comparison | Source: TradingView
However, there is one major difference this time around. The Ichimoku indicator itself can be overwhelming, with several other lines and indicators offering other information about the market.
For example, when the Tenken Sen and Kijun Sen lines cross, it can be a bullish or bearish signal depending on which is on top. In 2016, XRP was still bearish based on the crossover when it lost the cloud. This time around, XRP is bullish on weekly timeframes.
The last time Ripple got over the cloud, magic happened. Is that’s what is next, or will the cryptocurrency fall one more time? If so, another 60% fall and four months may be left before the explosive rally happens. But when it does, it will be more than worth waiting for.


