Historically, a weaker United States Dollar leads to strength across other “safe haven” assets. By analyzing the correlation, such momentum and conclusion can also be drawn with Bitcoin (BTC) and the USD.
Bitcoin has gained in 2020 as the U.S. Dollar Currency Index (DXY) has been having a tough year. But will this momentum continue in the coming months? Let’s take a closer look at the charts.
Bitcoin has to hold the $11,000 support level to avoid a CME gap test at $9,600
BTC/USD 1-day chart. Source: TradingView
The triangle broke upward as the majority of the markets were waiting for a climax to occur, resulting in a rally towards $11,700 and the breakthrough of the crucial $11,000-11,200 resistance zone.
However, to sustain the bullish momentum, support has to hold at this $11,000-11,200 area for a test of the $12,000 resistance area to occur.
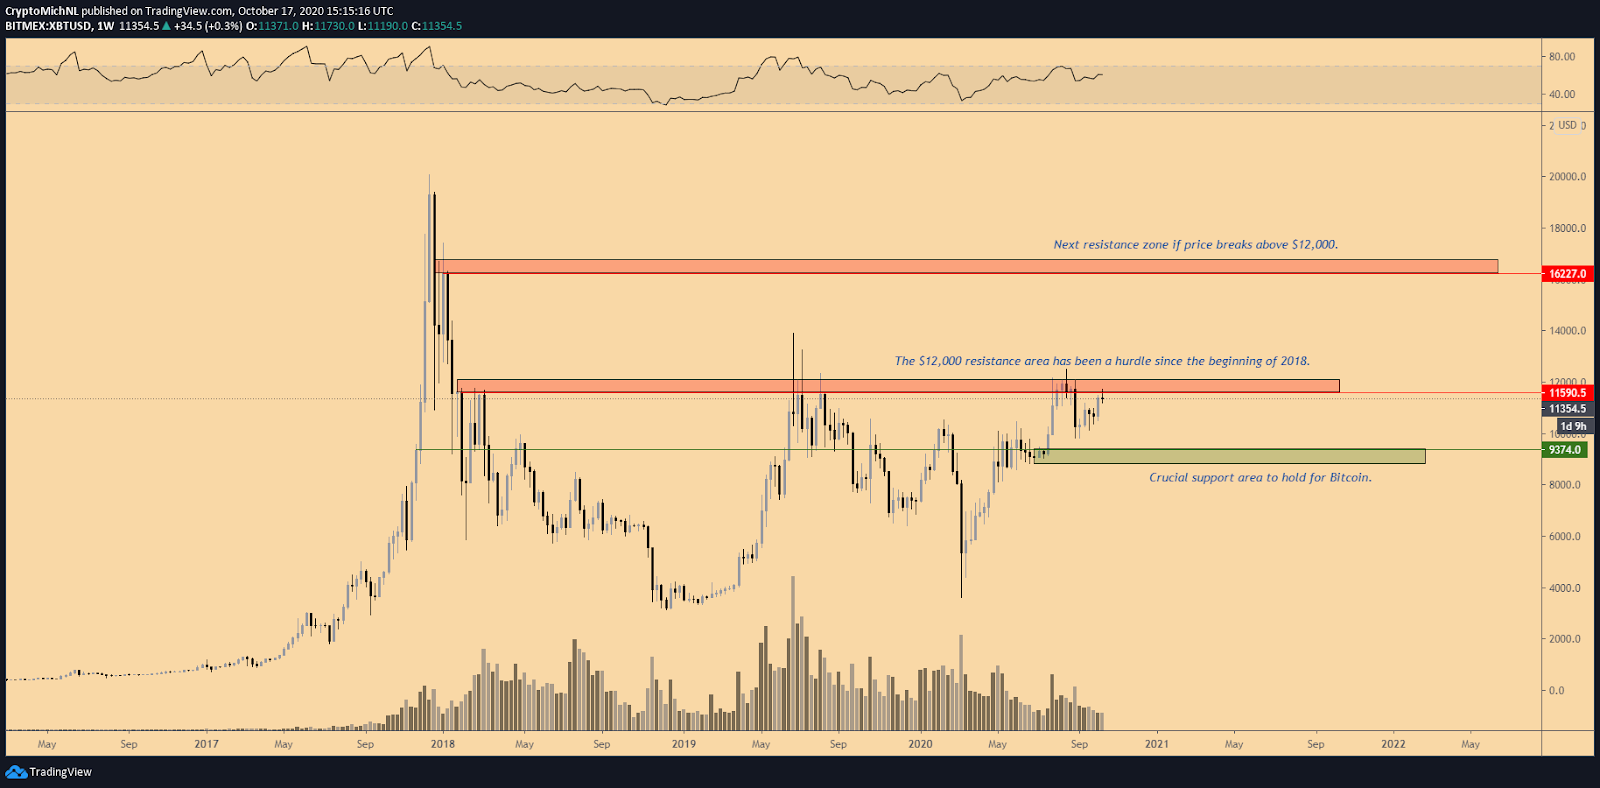
BTC/USD 1-week chart. Source: TradingView
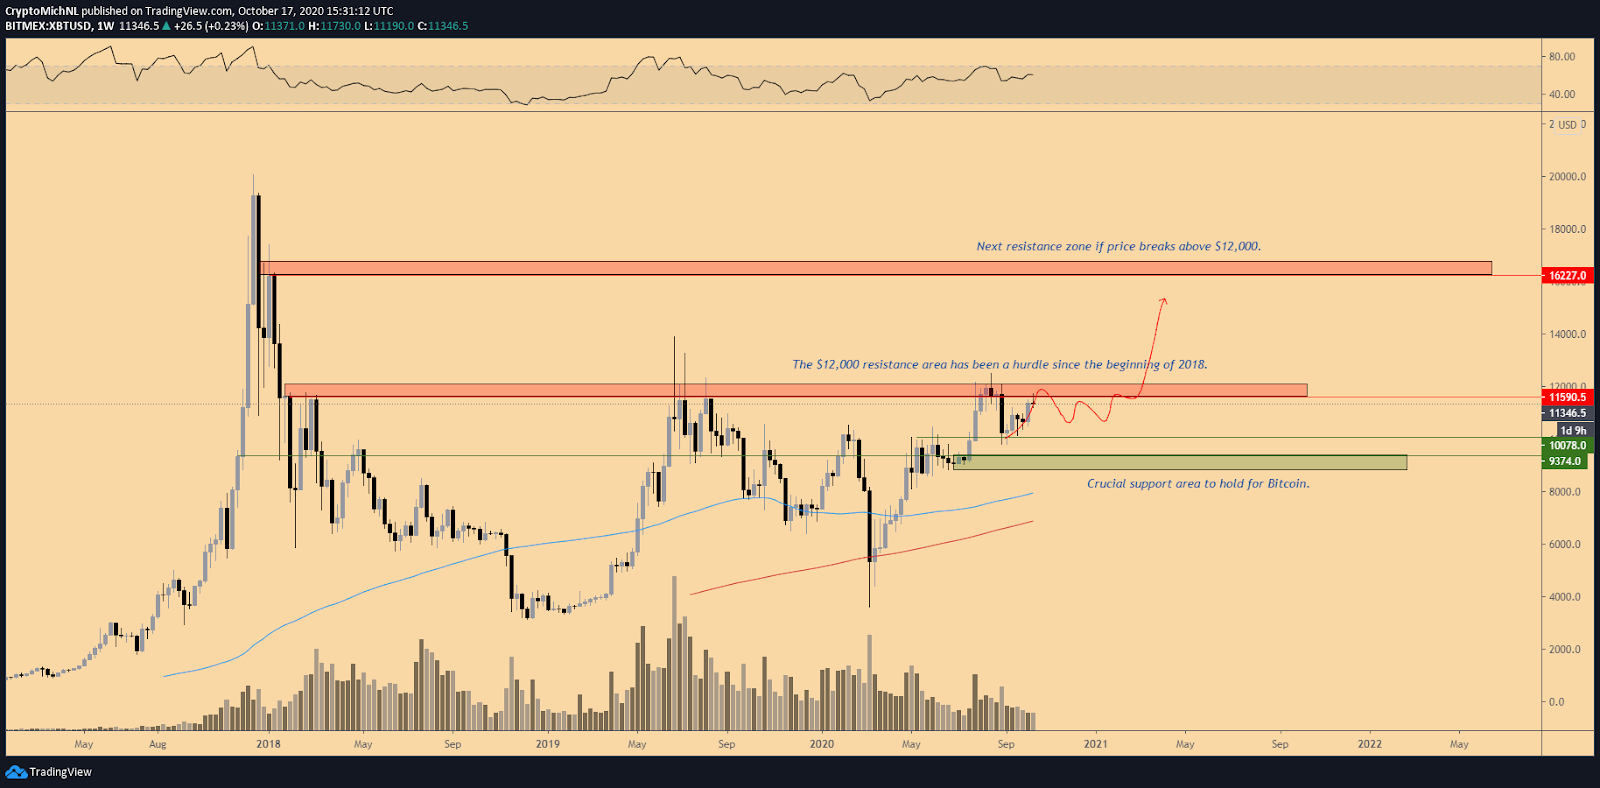
The weekly chart of Bitcoin is showing the significance of the $12,000 resistance level. Since the bear market started, the $12,000 area has been a big hurdle.
This crucial barrier led to multiple tests of this zone. However, a breakthrough didn’t occur yet. But the general consensus is that the more often a level gets tested, the weaker it becomes.
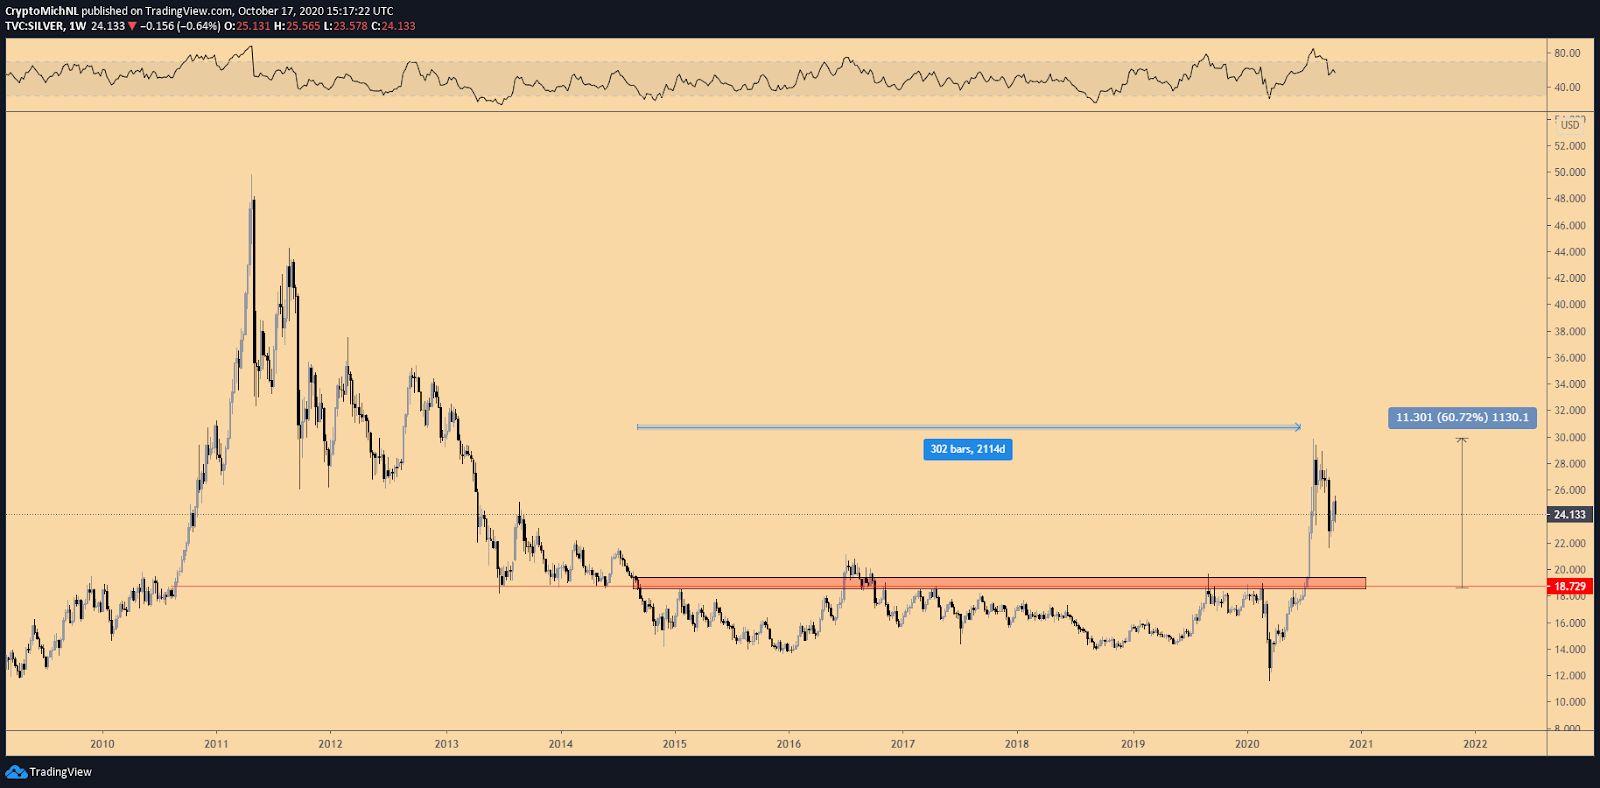
As an example, it took silver almost seven years to break through the resistance of $18.
Silver 1-week chart. Source: TradingView
This breakout took a long time, as silver’s price was constantly rejected at the $18 barrier. However, the breakthrough of the $18 level resulted in a massive move with the rally continuing toward $30, a 60% increase since the breakout.
But while that’s not much for enthusiasts in the cryptocurrency markets, it’s a large move for the commodity markets. Therefore, a breakthrough of the $12,000 barrier should result in a massive move for Bitcoin as well as the first big hurdle is found between $16,500-17,500.
Such a move would result in almost 50% as well.
A weaker dollar would suit Bitcoin well
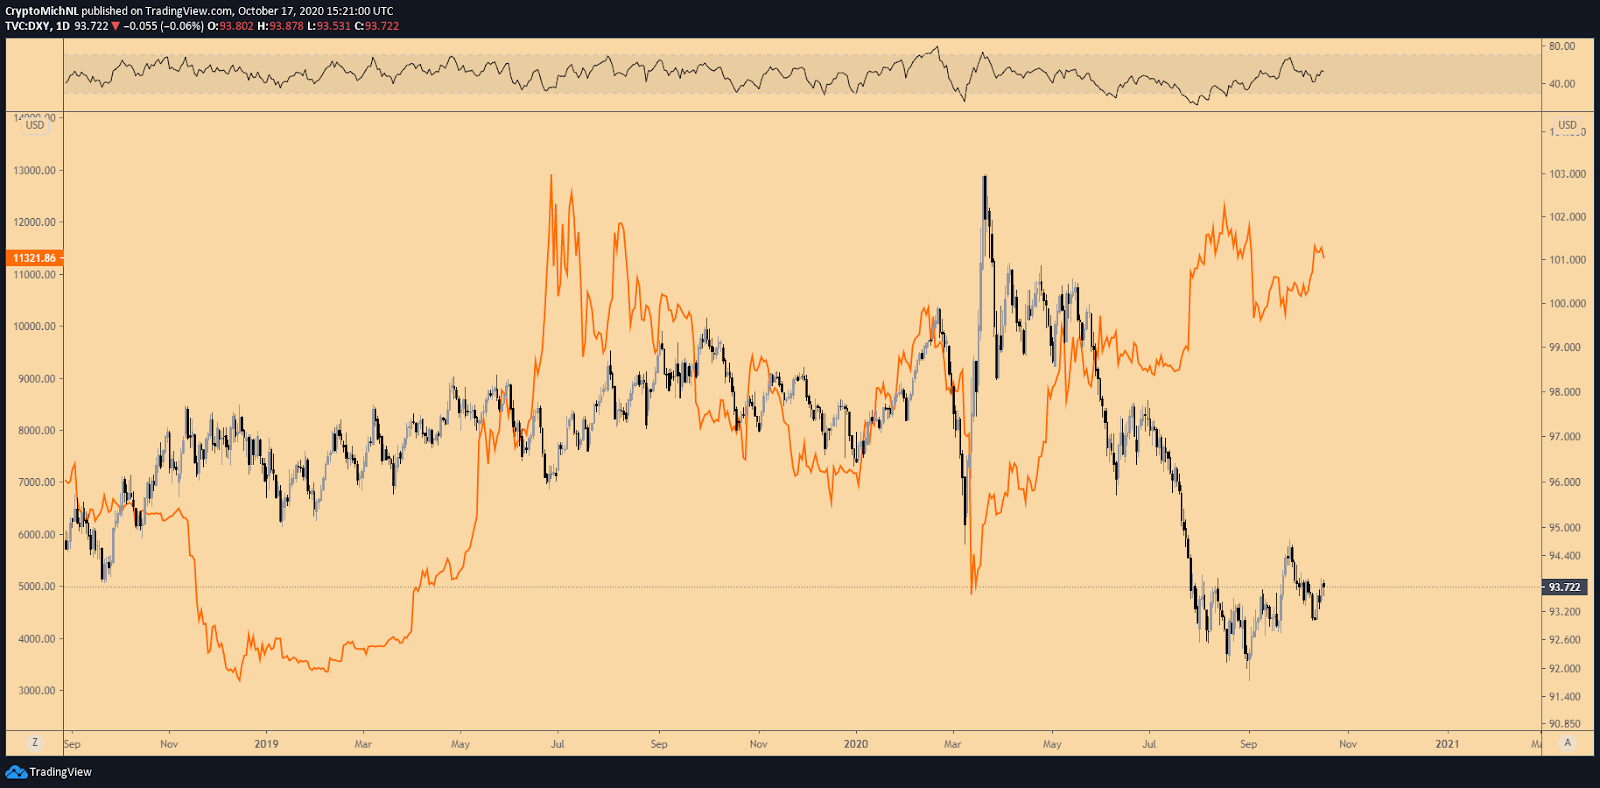
DXY vs. BTC/USD 1-day charts. Source: TradingView
In recent months, the U.S. Dollar Currency Index has been the center of many discussions regarding Bitcoin’s movements.
Quite clear, they do move in the opposite ways of each other, resulting in the conclusion that a weaker U.S. Dollar benefits the price of Bitcoin. This is also the main reasoning behind big institutional investors taking a position in Bitcoin, a major signal of an upcoming new cycle.
Indeed, the inverse correlation is evident and quite natural as the global economy is built around the world reserve currency, the U.S. Dollar.
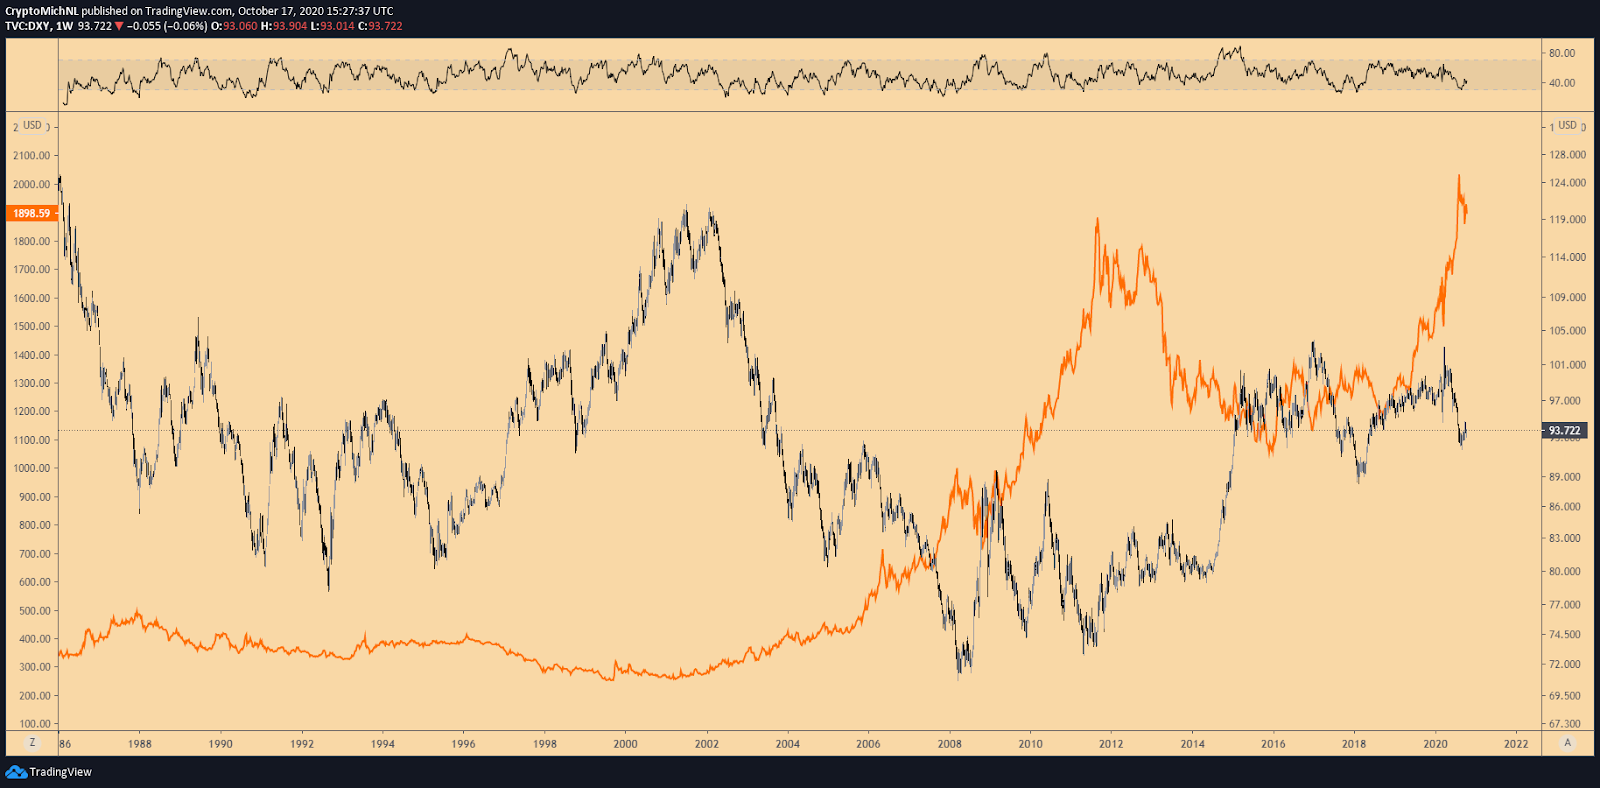
DXY vs. Gold 1-week chart. Source: TradingView
The primary example of weaknesses surrounding the U.S. Dollar is found in the reaction of gold since the dot com bubble of 2000.
Since the collapse of the markets in that year, the U.S. dollar lost its value, resulting in a rally of 600% on gold in the years after. Silver even rallied 1,100% in this period.
Similarly, when the U.S. Dollar started to show strength, gold and silver retraced heavily as expected.
Therefore, since the recent weakness of the U.S. Dollar resulted in a rally around the commodity markets, this would also benefit any momentum in Bitcoin in the coming years. This momentum is often classified as “opting out of the system’” by Bitcoin believers.
The most likely scenario for Bitcoin
BTC/USD 1-week chart. Source: TradingView
The most likely scenario would be a continued range-bound structure with some further tests at lower levels.
Multiple arguments can be drawn for this scenario. The first one is the overall weakness of Ethereum so far in Q4, resulting in the overall weakness of the crypto market.
In general, the month of January is a perfect month for Ethereum and the markets. However, a breakout in this quarter of the year is unlikely given all the uncertainties surrounding the global economy at this stage.
The second argument is the conclusion that the market is still in the build-up of a new cycle. Throughout these build-ups, accumulation ranges are defined, building momentum for the next impulse move to occur.
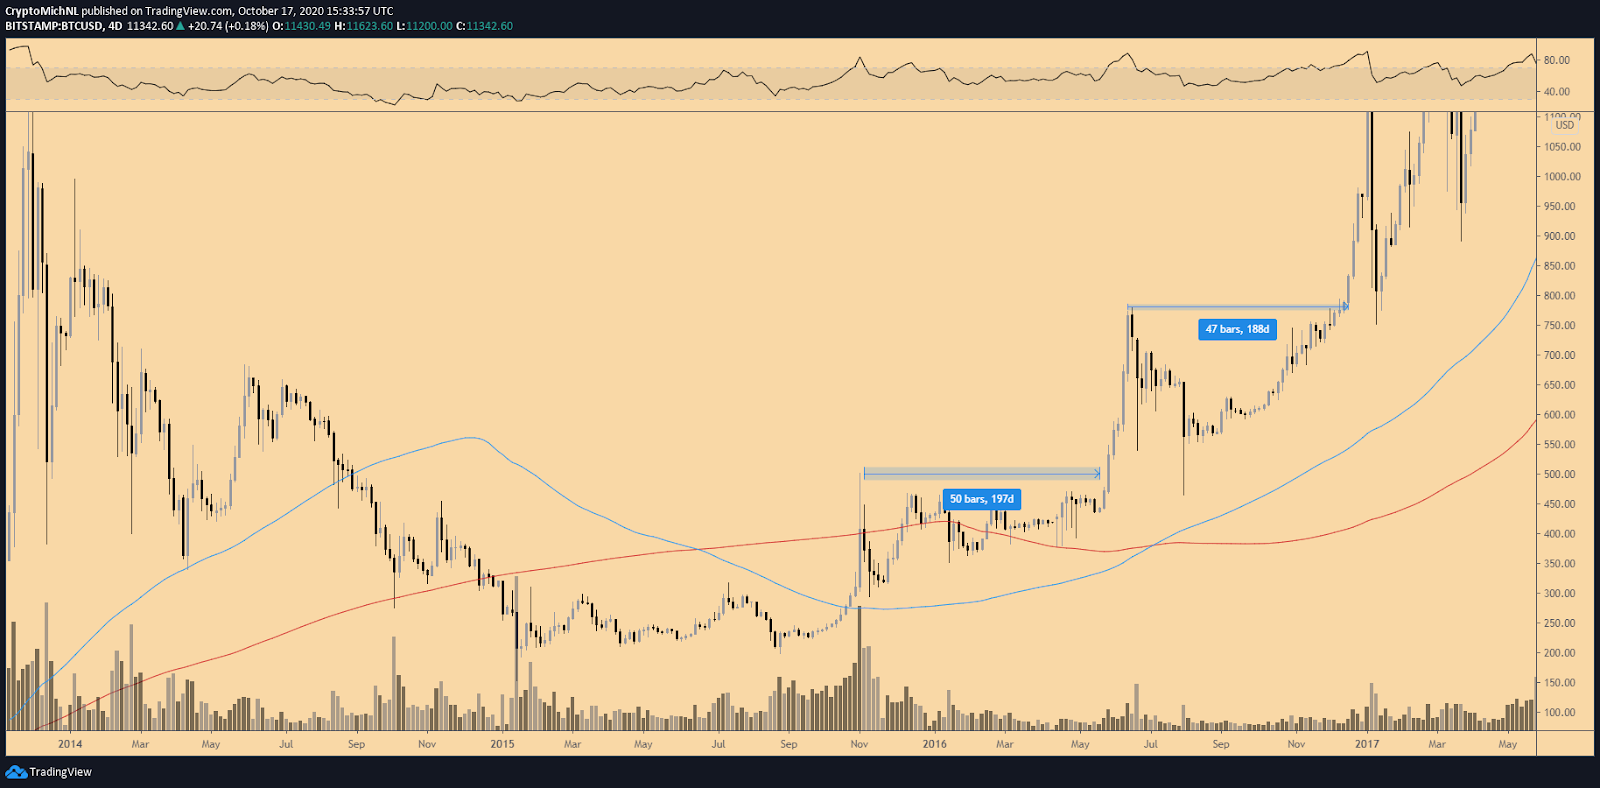
BTC/USD 4-day chart. Source: TradingView
The 4-day chart of Bitcoin shows similarities with the start of the previous cycle in 2016. Long, sideways constructions were building up momentum, after which a big impulse move occurred towards the next resistance level.
That’s the most likely scenario at this point as the market is still building up for the next big cycle. This cycle will take the market to levels not seen before, but it won’t happen in one go.
Therefore, accumulation is a critical part of the build-up in such a market, which appears to be currently happening.
The views and opinions expressed here are solely those of the author and do not necessarily reflect the views of Cryptox. Every investment and trading move involves risk. You should conduct your own research when making a decision.


