Bitcoin price (BTC) fell 5% today to a new weekly low at $8,660, a point which is also below the 200-day moving average which has been acting as support since reclaiming it in the final week of October.
Almost all other crypto-assets have also suffered a valuation loss against the U.S. dollar, but there has been some resilience shown in both Ether (ETH) and EOS, which have continued to outperform Bitcoin over the last week.
Cryptocurrency market daily view. Source: Coin360
Why Bitcoin broke down from $9,000
BTC USD Daily chart. Source: TradingView
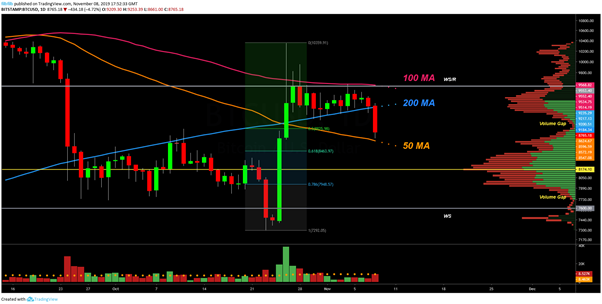
Bitcoin has been trading hard up against historical weekly support and resistance at $9,550. This also coincided with the 100-day moving average (DMA), unable to establish any kind of sustained attempt to break above.
The pinch between the 100-DMA acting as resistance and the 200 as support, led to a failure and an immediate drop through the volume gap where price doesn’t have much local history. The 50-DMA and the previous range high have subsequently come to support price above the 61.8% retracement from the move up to $10K from the mid $7K lows.
This is a technical trading area, which will be of interest to some profit takers and buyers. If Bitcoin is to maintain a move higher in the near term, we should expect to see BTC attempt to retake the previous support at $9,000.
The bearish case for Bitcoin
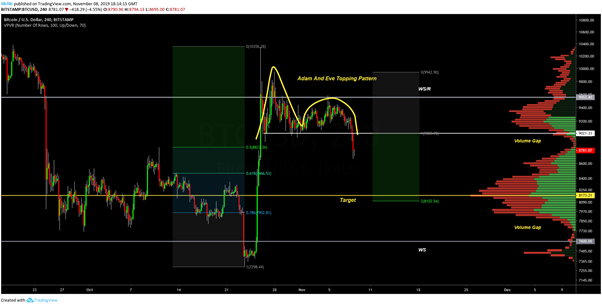
The bearish case for bitcoin is that this is simply the first leg lower after a failed move higher off the back of a news event. Failed moves often lead to fast moves and, as we have seen, Bitcoin has fallen out of support.
Bitcoin has a well-defined topping pattern that has clearly broken down, called Adam and Eve. The measured move target for such a pattern is 100% of the V-shaped “Adam”, which would take Bitcoin down to a price in the low $8,000s and back to the point of volume control in recent times.
A move back here would also go back between the 61.8% and 78.6% retracement, which is an area of potential buying interest for bulls looking to reaccumulate, having either taken profits on the move higher or simply looking to take their technical profits off the breakdown.
This pattern would be invalidated if Bitcoin can break and reestablish price action above the previous support level of $9,000.
BTC USD 4-hour chart. Source: TradingView
Bullish Case
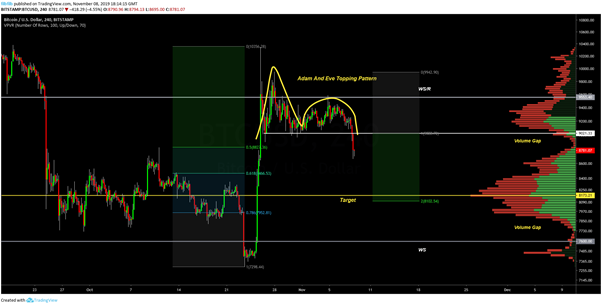
The bullish case for Bitcoin is that a reasonably sharp reaction has been seen by the bulls who have stopped price dead so far following the breakdown.
If the bulls can establish support here, it is possible that the move lower was simply an inevitable stop run that occurred due to leveraged long positions being taken on by overly enthusiastic traders who were in fear of missing out on a higher Bitcoin move.
BTC USD 4 hour chart. Source: TradingView
An early sign if this was simply a stop run and for Bitcoin to attempt a significant move higher will be if the bulls can take advantage of the typically low volume weekend retaking $9,000 as support. This would give a high probability of a retest of at least weekly resistance at $9,550, if not $10,000.
This will be an important weekend for Bitcoin, which could easily lead to further volatility. Reclaiming the $9K range is a clear objective for the bulls over the weekend. Otherwise, a more extended period consolidating likely lies ahead in the $8,000s.
The views and opinions expressed here are solely those of the author and do not necessarily reflect the views of CryptoX. Every investment and trading move involves risk. You should conduct your own research when making a decision.


