Bitcoin price is a mere $2,000 away currently from setting a new high and shocking the world that the cryptocurrency rose from the ashes like a Phoenix once again. The currently flaming hot cryptocurrency is the talk of the world of finance, and it has resulted in altcoins suffering significantly over the last several weeks.
While much of the cryptocurrency community expects alt season to follow the moment Bitcoin corrects and consolidates, BTC dominance could be forecasting that any improvement in the altcoin trend could be many months out. Here’s what the metric measuring the first-ever cryptocurrency growing market cap against the rest of the crypto industry has to say about altcoins.
Epic 2020 Bitcoin Rally Leaves Altcoins At Risk Of Capitulation
Bitcoin is trading at $18,000 and its total market cap has set a new higher high over the 2017 peak. All signs point to an extended Bitcoin bull run, after perhaps one more correction.
The last time around when the first-ever cryptocurrency went parabolic, altcoins followed. Two distinct altcoin seasons occurred, one during the initial run-up, then another when Bitcoin reached its all-time high, and retail investor FOMO flooded altcoins with capital.
The mainstream hadn’t heard of Bitcoin, let alone altcoins. With BTC trading at psychologically expensive prices, and the average investor finding comfort in whole rounded numbers, altcoins appeared to be the better option. The allure of discovering the next Bitcoin early pushed retail towards alts, and they have done nothing but suffer since.
BTC dominance dropped from a higher of over 90% to as low as 35%. The 2019 rally peak left altcoins reeling, causing dominance to top out at around 72%. Now, BTC represents exactly two-thirds of the total crypto market cap, according to dominance.
Related Reading | Bulls In Control: Total Bitcoin Market Cap Achieves New All-Time High
Bitcoin has attracted a new class of investors, who have next to zero interest in most altcoins that don’t have anywhere near the promise, appeal, adoption, and regulatory acceptance as BTC.
As smart money comes in, comprised of billionaires, hedge funds, corporations, and more, they’ll be focusing on BTC exclusively. In the current economic environment, Bitcoin’s benefits are being viewed as a safe haven and insurance policy, while altcoins carry a significant risk of capital loss.
Alts like Ethereum, XRP, Litecoin, and the tried and true coins could also benefit, but tokens way down the ranks are potentially doomed into obscurity. The one saving grace is another wave of retail investors searching for the next BTC and another alt season taking place, but that could be a significant way off, according to technicals and not just the current sentiment.
A possible breakout of a four-year trendline on BTC.D happens with a close on Sunday night | Source: CRYPTOCAP-BTC on TradingView.com
Five BTC Dominance Charts That Suggest Alt Season Is Postponed
Pure technicals don’t look promising for altcoins, based on BTC dominance. The metric measuring Bitcoin against all other altcoins puts the cryptocurrency at about two-thirds of the crypto market’s total market share.
The chart above highlights what appears to be a breakout from a trendline that first let altcoins gain some ground with Bitcoin stretching back as far as early 2017.
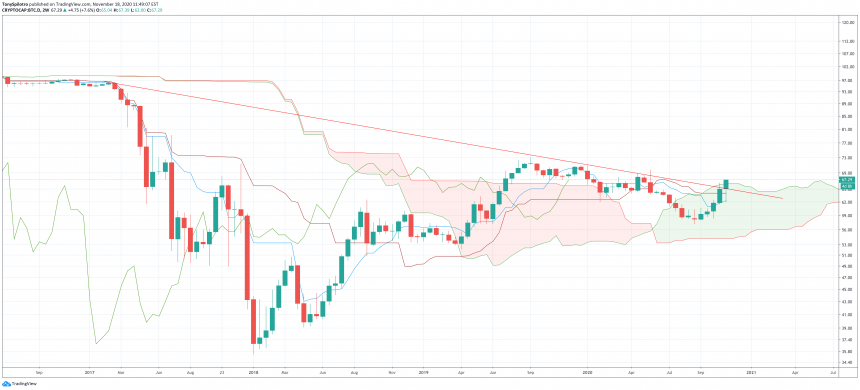
The breakout is supported by the Ichimoku cloud, but the candle must close to confirm | Source: CRYPTOCAP-BTC on TradingView.com
Adding credence and validity to the breakout is the fact that the price action is currently above the Ichimoku cloud on high timeframes. A close above the cloud would lead to a strong push higher.
Related Reading | Bitcoin Approaches Top Of Accumulation Zone, Parabolic Phase Begins With Breakout
In the chart below, the monthly BTC.D chart is also closing above the middle-line on the Bollinger Bands. The metric climbed another 30% the last time it closed above the moving average and usually guarantees at least a touch of the upper Bollinger Band which currently resides at 2019 highs.
Altcoins have until the end of November, to prevent dominance from soaring to the top of the Bollinger Bands | Source: CRYPTOCAP-BTC on TradingView.com
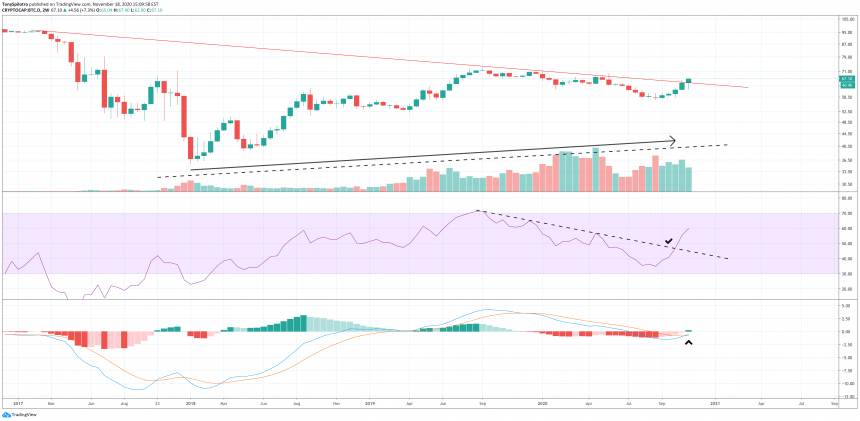
Although there are five charts total, the final chart has three more signals that are extremely bearish for altcoins. The Relative Strength Index is nowhere near oversold levels, and recently broke out from a downtrend line, letting the top cryptocurrency rip against alts.
The MACD is also flipping bullish via crossover for the first time since April 2019. The histogram also turned green for the first time since March 2018, just as the last significant altcoin season ended.
The RSI, MACD, and volume all point to further BTC crypto market dominance | Source: CRYPTOCAP-BTC on TradingView.com
Altcoins have never quite recovered since 2018, and the increasing volume above on BTC.D suggests that the trend of favoring Bitcoin over altcoins is only strengthening.
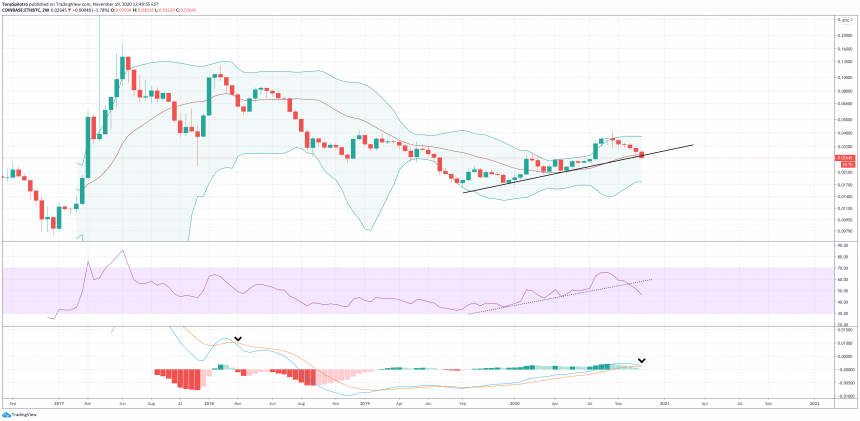
For the naysayers that argue charting dominance is worthless, the ETHBTC chart – often used to gauge altcoins strength or weakness against BTC – gives signals inverse to all the above, pointing to a deep collapse in Ethereum while BTC runs to new all-time highs.
The Ethereum ratio against BTC also suggests altcoin capitulation is coming | Source: ETHBTC on TradingView.com
The next two weeks are especially critical for altcoins, and are facing a bounce or die type situation against the only just blossoming Bitcoin bull trend.
If Sunday night’s two-week close and the monthly November close at or above current levels, alt season could be delayed indefinitely, or at least for a few more months until retail is sucked back in.
Featured image from Deposit Photos, Charts from TradingView.com


