

Bitcoin (BTC) fell below $75,000 on April 6, pressured by traditional markets as S&P 500 futures hit their lowest levels since January 2024. The initial panic also caused WTI oil futures to drop below $60 for the first time in four years. However, markets later recovered some losses, allowing Bitcoin to reclaim the $78,000 level.
Bitcoin’s high correlation with traditional markets tends to be short-lived
While some analysts argue that Bitcoin has entered a bear market following a 30% price correction from its cycle peak, historical data offers numerous examples of even stronger recoveries. Notably, Bitcoin’s high correlation with traditional markets tends to be short-lived. Several indicators suggest traders are simply waiting for better entry opportunities.
40-day correlation: S&P 500 futures vs. Bitcoin/USD. Source: TradingView / Cointelegraph
Bitcoin’s recent performance has been closely tied to the S&P 500, but this correlation fluctuates significantly over time. For example, the correlation turned negative in June 2024 as the two asset classes moved in opposite directions for nearly 50 days. Furthermore, while the correlation metric exceeded the 60% threshold for 272 days over two years—roughly 38% of the period—this figure is statistically inconclusive.
The recent Bitcoin price drop to $74,440 reflects heightened uncertainty in traditional markets. While periods of unusually high correlation between Bitcoin and traditional assets have occurred in the past, they rarely last long. Furthermore, most major tech stocks are currently trading down by 30% or more from their all-time highs.
Gold failed as a “store of value” between 2022 and 2024
Even with a $1.5 trillion market capitalization, Bitcoin remains one of the top 10 tradable assets globally. While gold is often regarded as the only reliable “store of value,” this perspective overlooks its volatility. For instance, gold dropped to $1,615 by September 2022 and took three years to recover its previous all-time high of $2,075.
Although gold boasts a $21 trillion market capitalization—14 times higher than Bitcoin’s—the gap in spot exchange-traded fund (ETF) assets under management is much narrower: $330 billion for gold compared to $92 billion for Bitcoin. Additionally, Bitcoin-listed instruments like the Grayscale Bitcoin Trust (GBTC) debuted on exchanges in 2015, giving gold a 12-year advantage in market presence.
Bitcoin ETFs’ importance and resilience in BTC derivatives
From a derivatives standpoint, Bitcoin perpetual futures (inverse swaps) remain in excellent condition, with the funding rate hovering near zero. This indicates balanced leverage demand between longs (buyers) and shorts (sellers). This is a sharp contrast to the period between March 24 and March 26, when the funding rate turned negative, reaching 0.9% per month—reflecting stronger demand for bearish positions.

Bitcoin perpetual futures 8-hour funding rate. Source: Laevitas.ch
Additionally, the $412 million liquidation of leveraged long positions between April 6 and April 7 was relatively modest. For comparison, when Bitcoin’s price dropped by 12.6% between Feb. 25 and Feb. 26, liquidations of leveraged bullish positions totaled $948 million. This suggests that traders were better prepared this time or relied less on leverage.
Finally, stablecoin demand in China offers further insight into market sentiment. Typically, strong retail demand for cryptocurrencies drives stablecoins to trade at a premium of 2% or more above the official US dollar rate. Conversely, a premium below 0.5% often signals fear as traders look to exit crypto markets.
Related: Michael Saylor’s Strategy halts Bitcoin buys despite dip below $87K
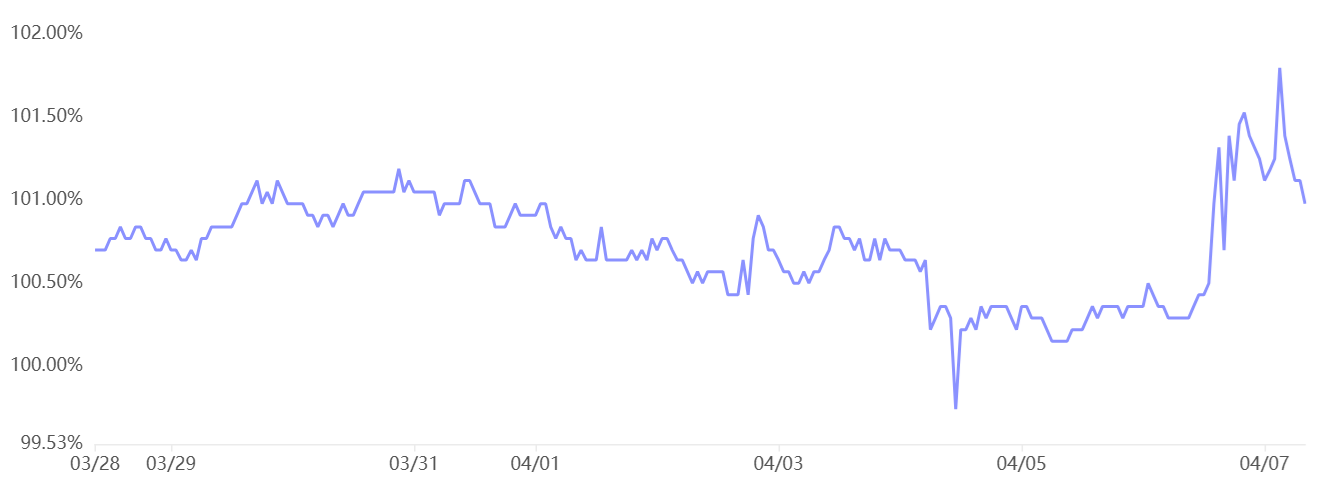
USDT Tether (USDT/CNY) vs. US dollar/CNY. Source: OKX
The premium for USD Tether (USDT) remained at 1% on April 7, even as Bitcoin’s price dropped below $75,000. This suggests that investors are likely shifting their positions to stablecoins, potentially waiting for confirmation that the US stock market has reached its bottom before returning to cryptocurrency investments.
Historically, Bitcoin has shown a lack of correlation with the S&P 500. Additionally, the near-zero BTC futures funding rate, relatively modest futures liquidations totaling millions, and the 1% stablecoin premium in China point to a strong likelihood that Bitcoin’s price may have found a bottom at $75,000.
This article is for general information purposes and is not intended to be and should not be taken as legal or investment advice. The views, thoughts, and opinions expressed here are the author’s alone and do not necessarily reflect or represent the views and opinions of Cointelegraph.


