Uniswap price displayed almost no movement over the last 24 hours as the coin registered 0.8% downward movement on its chart. UNI was hovering around the $7 price level and was unable to break past its closest price ceiling. If the coin does not manage to move past the resistance level then it could lose its support line.
Technical outlook for Uniswap price indicated that could it register further drop on the chart. Move to the above resistance level will be difficult as buyers have exited the market. Increased selling pressure can push Uniswap price to the next support level.
Bitcoin price also fell considerably over the last 24 hours. The coin fell to $21,000 and the altcoins moved in the same direction. Broader market weakness have made Uniswap price remain at the current price level. The global cryptocurrency market cap today is at $1.07 Trillion, with a 1.0% negative change in the last 24 hours.
Uniswap Price Analysis: Four Hour Chart
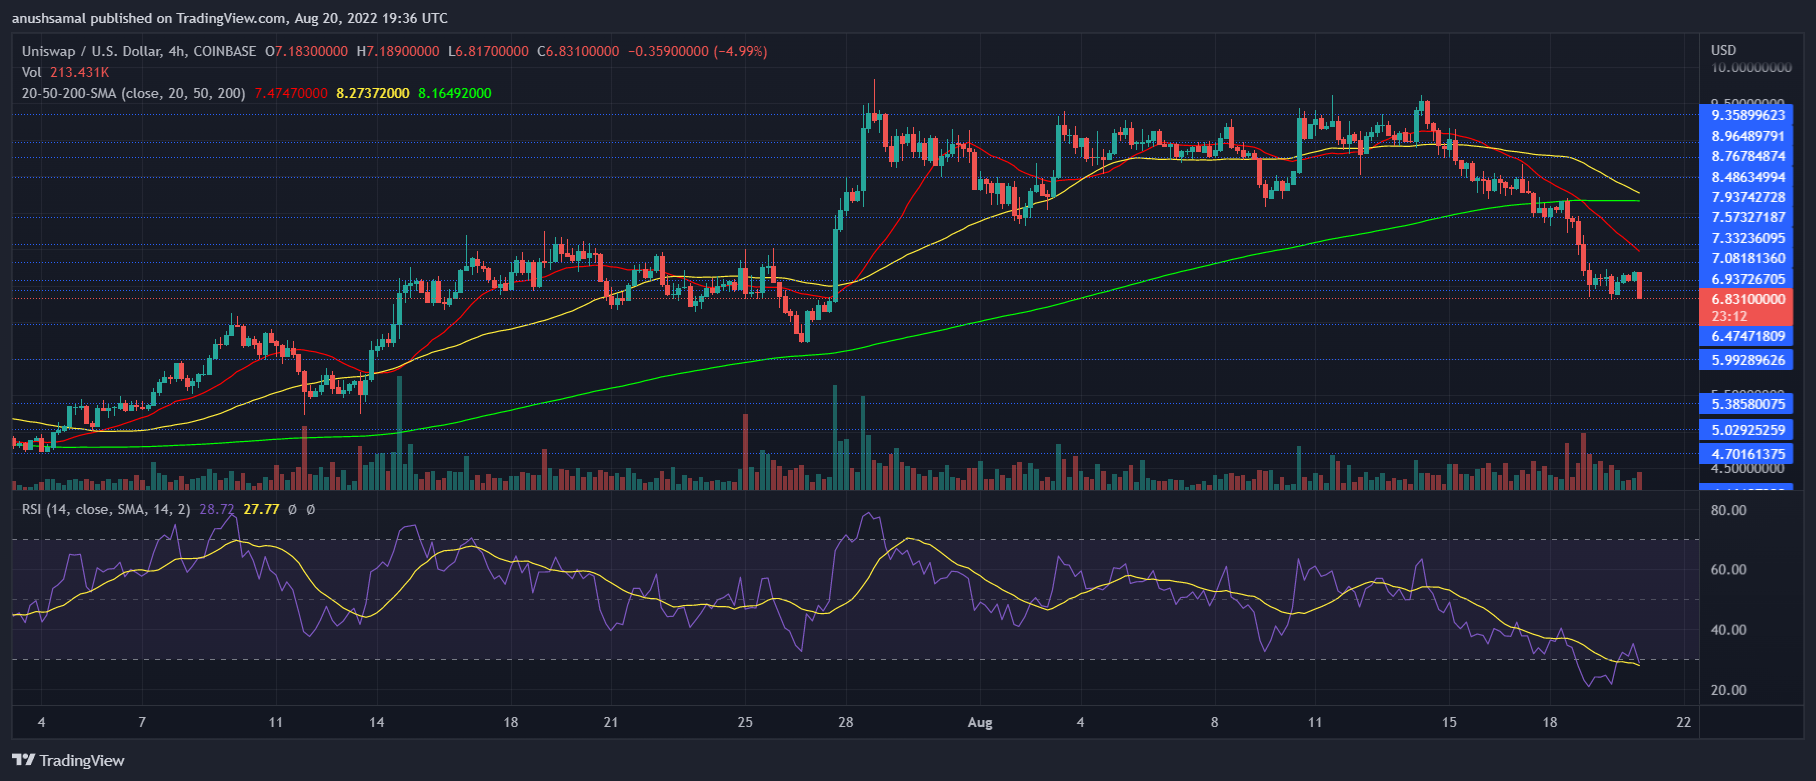
UNI was trading for $7.01 at the time of writing. The overhead resistance for the coin stood at $7.57. Uniswap price has been unable to move past the price ceiling which is why the coin was met with selling pressure.
A fall from the current price level will push Uniswap price to $6.90 immediately, if the coin cannot remain steady over the aforementioned level then the next price level stood at $5.99. Amount of Uniswap traded in the last session fell which meant that the selling pressure was high in the market.
Technical Analysis

UNI was moving laterally and this has caused selling pressure to mount on the four hour chart. It was also an indication that an upcoming fall in chart could be expected.
The Relative Strength Index was in the oversold region however, over the last 24 hours the coin noted an uptick.
Despite the uptick sellers were considerably higher than buyers on the four hour chart. Uniswap price was below the 20-SMA line which indicated that sellers were driving the price momentum in the market.

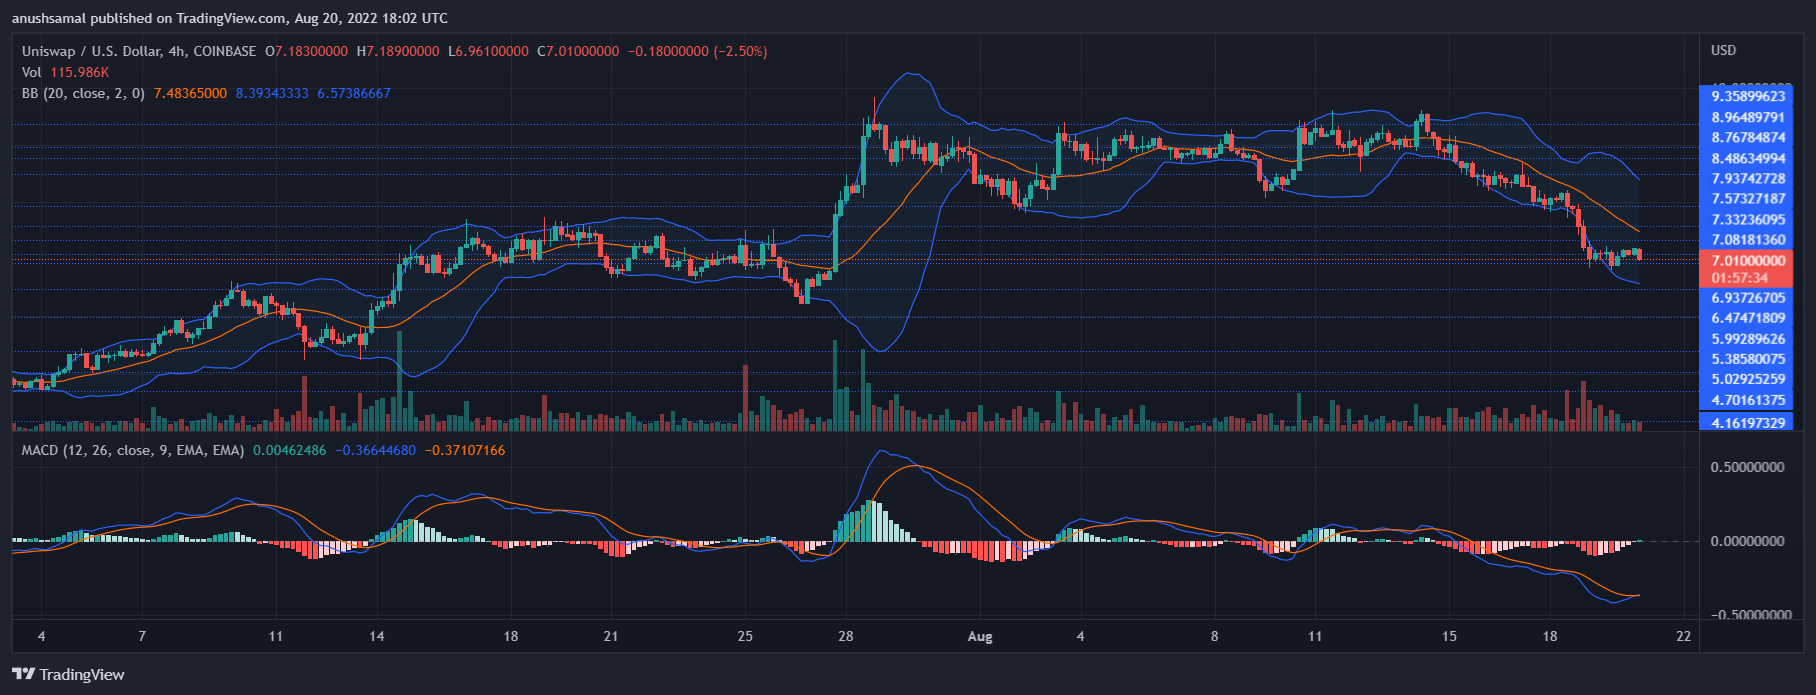
UNI’s laterally trading had pushed price near to its immediate support level. The influx of sellers made technical indicator point towards a sell signal however over the last 24 hours the coin started to capture a buy signal.
The Moving Average Convergence Divergence depicts the price momentum and reversal in the same. MACD underwent a bullish crossover with green histograms on the half-line which meant that there was buy signal for the coin.
Bollinger Bands help understand the price volatility and chance of price fluctuation. Bands were wide open and parallel which suggested that price might witness a move up or down over the upcoming trading sessions.


