Swiss finance minister and outgoing president Ueli Maurer believes that one of the most ambitious crypto projects of 2019, Facebook’s Libra stablecoin, will not be accepted by regulators in its current form. Though Libra has not seen the light of the day, it has forced a number of central banks to take cryptocurrencies seriously.
China could be one of the first developed nations to launch a central bank digital currency. Though cryptocurrency trading is banned in China, the regulators are worried about its comeback. The Chinese government wants to ensure that the digital form of yuan, when launched, does not face competition from cryptocurrencies. Hence, the Chinese securities regulators have urged authorities to stifle any resurgence of cryptocurrencies.
Crypto market data weekly view. Source: Coin360
The United States stock markets usually rally in the last five trading days of the calendar year and the first two days of the new year. The rally during this period is popularly called as Santa rally. This year, both gold and the U.S. stock markets have been strong in the past few weeks while the crypto markets have failed to pick up steam. Peter Schiff was quick to point this out. However, he conveniently omitted that Bitcoin has hugely outperformed both the US stock markets and gold in 2019.
As the year comes to an end, do we find any promise in the top performers of the past seven days? Can they extend their rally in the new year? Let’s find out.
BCH/USD
Bitcoin Cash (BCH) has rallied close to 13% in the past seven days and has turned out to be the best performer among major cryptocurrencies. Do we spot a trend reversal and a buying opportunity? Let’s study the chart.
BCH USD weekly chart. Source: Tradingview
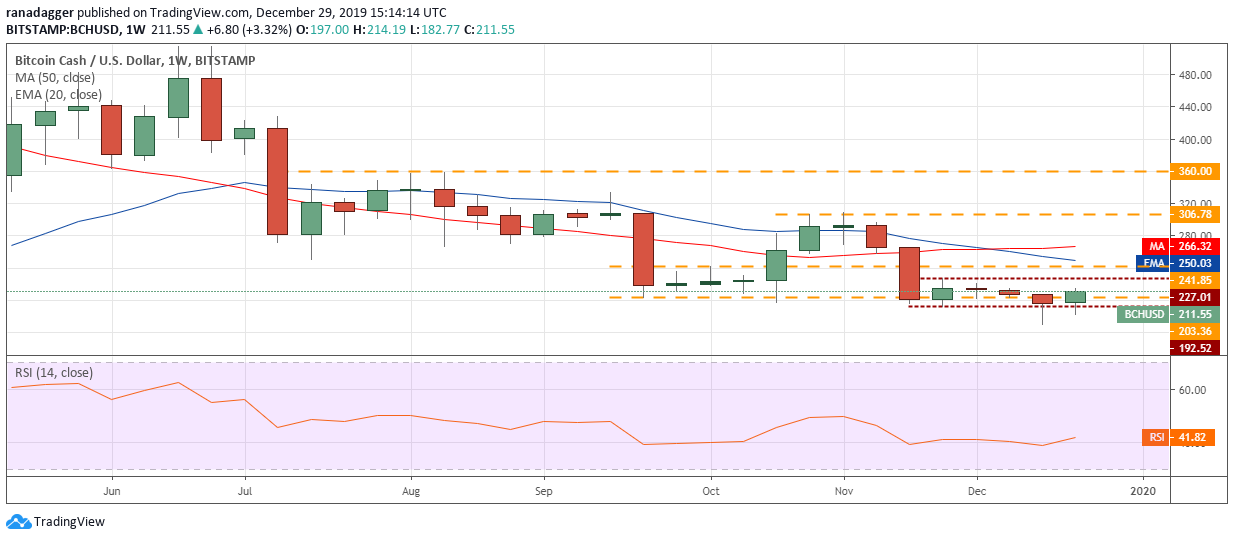
The BCH/USD pair has been trading inside the $227.01 to $192.52 range for the past few weeks. Though bears broke below $192.52 in the past two weeks, they could not sustain the lower levels, which shows that bulls are using the dips to buy.
The current attempt to bounce might face minor resistance at $227.01. However, if the bulls can scale the price above it, a move to $306.78 will be on the cards. The traders can buy on a close (UTC time) above $227.01 with a stop below $190.
The 20-week EMA at $240 and 50-week SMA at $266 might offer some resistance but we expect them to be crossed. Our bullish view will be invalidated if the pair turns down from $227.01 and plummets below $192.52.
BSV/USD
Bitcoin SV (BSV) has been the second-best performer in the past seven days with a rally of about 12%. There does not seem to be any specific news that has triggered the up move. So, will this relief rally fizzle out or does it signal the start of a new uptrend? Let’s find out.
BSV USD weekly chart. Source: Tradingview
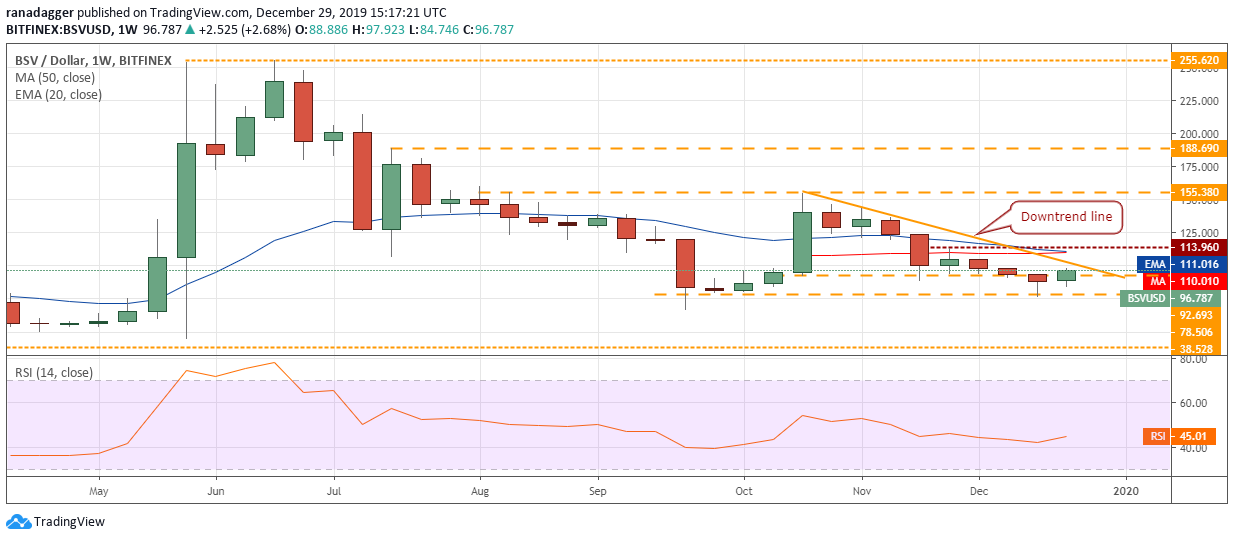
The BSV/USD pair is attempting to bounce off the critical support at $78.506, which is a positive sign. It shows that bulls are using the dips to buy. The relief rally might face resistance at the downtrend line and above it at the moving averages, located just below $113.96.
If the bulls scale the price above the moving averages, a rally to $155.38 is possible. Conversely, if the price turns down from $113.96, the pair might remain range-bound for a few more weeks.
The traders can initiate long positions on a close (UTC time) above the downtrend line with a stop below $77. The target objective is $155.38 but if the bulls struggle to push the price above $113.96, the positions can be closed.
ETC/USD
Ethereum Classic (ETC) was the third-best performer among major cryptocurrencies with a rally of over 10% in the past seven days. The community seems to be getting excited about the upcoming Agharta hard fork that intends to make ETC fully compatible with Ethereum (ETH). Will the altcoin bottom out on this news and start a new uptrend? Let’s analyze its chart.
ETC USD weekly chart. Source: Tradingview
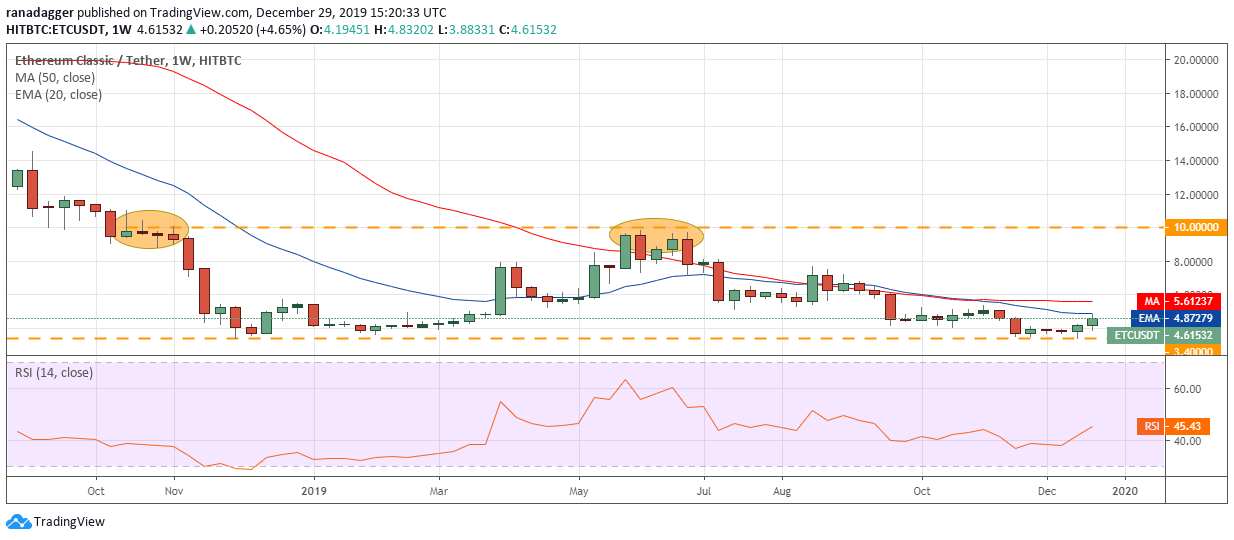
The ETC/USD pair has held the critical support at $3.40 for the past five weeks, which is a positive sign. It indicates accumulation by the bulls at lower levels. Currently, the bulls are attempting a rebound off the support.
Both the moving averages have flattened out and the RSI is gradually climbing towards the center, which suggests that the selling pressure has reduced. Still, the bounce might face a minor resistance at the moving averages. If the bulls can scale the price above the moving averages, a rally to $7.6 and above it to $10 is possible.
As the risk to reward ratio is attractive, traders can buy 50% of the desired position at the current levels and keep a stop loss below $3.30. Remaining 50% of the position can be added on a close (UTC time) above the 50-week SMA. Our bullish view will be invalidated if the pair turns around from the current levels and plummets below $3.30.
EOS/USD
Block.one, the firm behind the EOS blockchain and token has proposed a change to its current network resource allocation system. Under the new proposed system, the users will have to rent network resources.
The company believes that the transition will “remove the influence of speculative markets over resource pricing. Introducing a rental market with pricing based on overall resource utilization will make resource allocation more predictable and reliable for the community.”
EOS USD weekly chart. Source: Tradingview
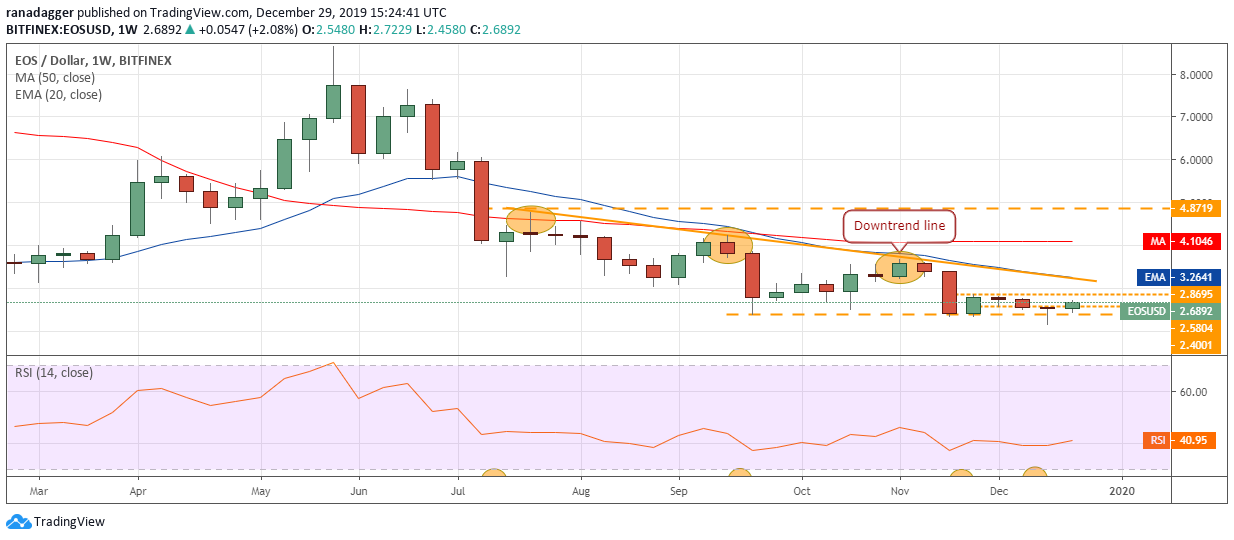
The EOS/USD pair has been trading between $2.8695 and $2.4001 for the past few weeks. Though the bears plummeted the price below the range, they could not sustain the lower levels. This is a positive sign as it indicates demand at lower levels.
The current bounce can reach $2.8695, above which a move to the downtrend line is possible. In the past few months, the pair has repeatedly turned down from the downtrend line. Hence, we anticipate the bears to defend it aggressively.
A breakout of the downtrend line will signal that the bulls are back in action. Above the downtrend line, a move to $4.8719 is possible. However, if the price again turns down from the downtrend line, the bears will attempt to sink the price below $2.5804. We will turn positive after the price sustains above the downtrend line.
ATOM/USD
This is the fourth time in the past five weeks that Cosmos (ATOM) has been among the top performers. This shows that the bulls continue to back it. Can it build on its strength in the new year?
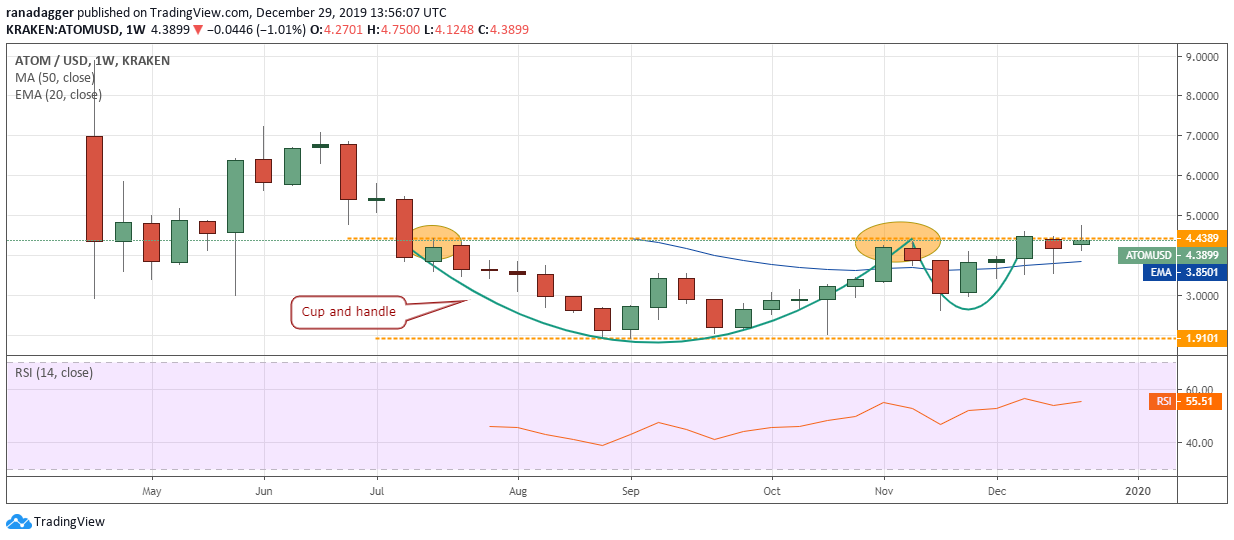
ATOM USD weekly chart. Source: Tradingview
The ATOM/USD pair completed a cup and handle pattern when it closed above $4.4389 on Dec. 15, which triggered our buy recommendation given in an earlier analysis.
However, the bulls could not build up on the breakout as we had expected and the price again dipped back to $3.5621. We like the way the bulls again bought the dip close to $3.5 levels. This shows that the bulls are accumulating on dips.
The price has again reached close to the overhead resistance at $4.4389. If the bulls can sustain the price above $4.4389, a rally to $6.9677 is likely. Therefore, traders can retain the stop loss on the long position at $3.40.
The views and opinions expressed here are solely those of the author and do not necessarily reflect the views of CryptoX. Every investment and trading move involves risk, you should conduct your own research when making a decision.
The market data is provided by the HitBTC exchange.


