Select altcoins such as FLOW, THETA, QNT, and MKR could rally if Bitcoin breaks above the stiff overhead resistance at $24,668.
The United States jobs data on Aug. 5 was above market expectations, indicating that inflation has not cooled down. The strong numbers reduce the possibility that the U.S. Federal Reserve will slow down its aggressive pace of rate hikes. After the release, the likelihood of a 75 basis points hike in September has risen to 68%, according to CME Group data.
However, analysts at Fundstrat Global Advisors have a different view. They highlighted that three out of six times, the S&P 500 bottomed out six months before the Fed’s last rate hike. Therefore, the firm anticipates the S&P 500 to witness a strong rally to 4,800 in the second half of the year.
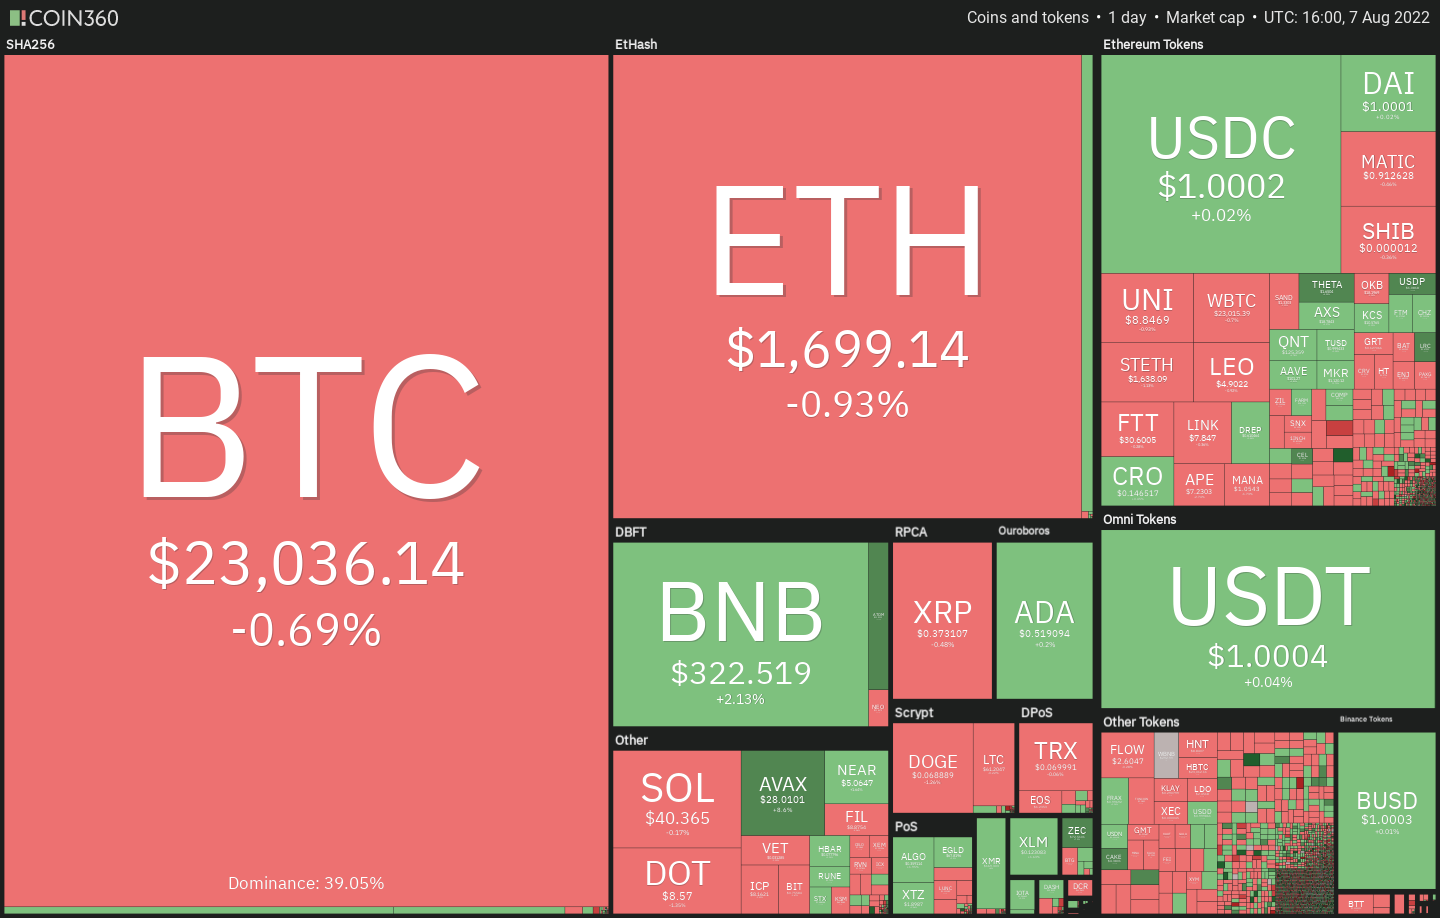
If the tight correlation between the equities markets and the cryptocurrency markets maintain, the recovery in the crypto markets may have some more room to run. On-chain monitoring resource Material Indicators said in a Twitter update on Aug. 5 that if Bitcoin (BTC) rises above $25,000, there is no major resistance till the $26,000 to $28,000 range.
Could Bitcoin climb above the overhead resistance and extend its recovery, pulling select altcoins higher? Let’s study the charts of the top-5 cryptocurrencies that may outperform in the near term.
BTC/USDT
Bitcoin has been trading close to the 20-day exponential moving average ($22,719) for the past few days, indicating a tough battle between the bulls and the bears. Although the bulls have held the level, they have not been able to achieve a strong rebound off it. This indicates a lack of demand at higher levels.
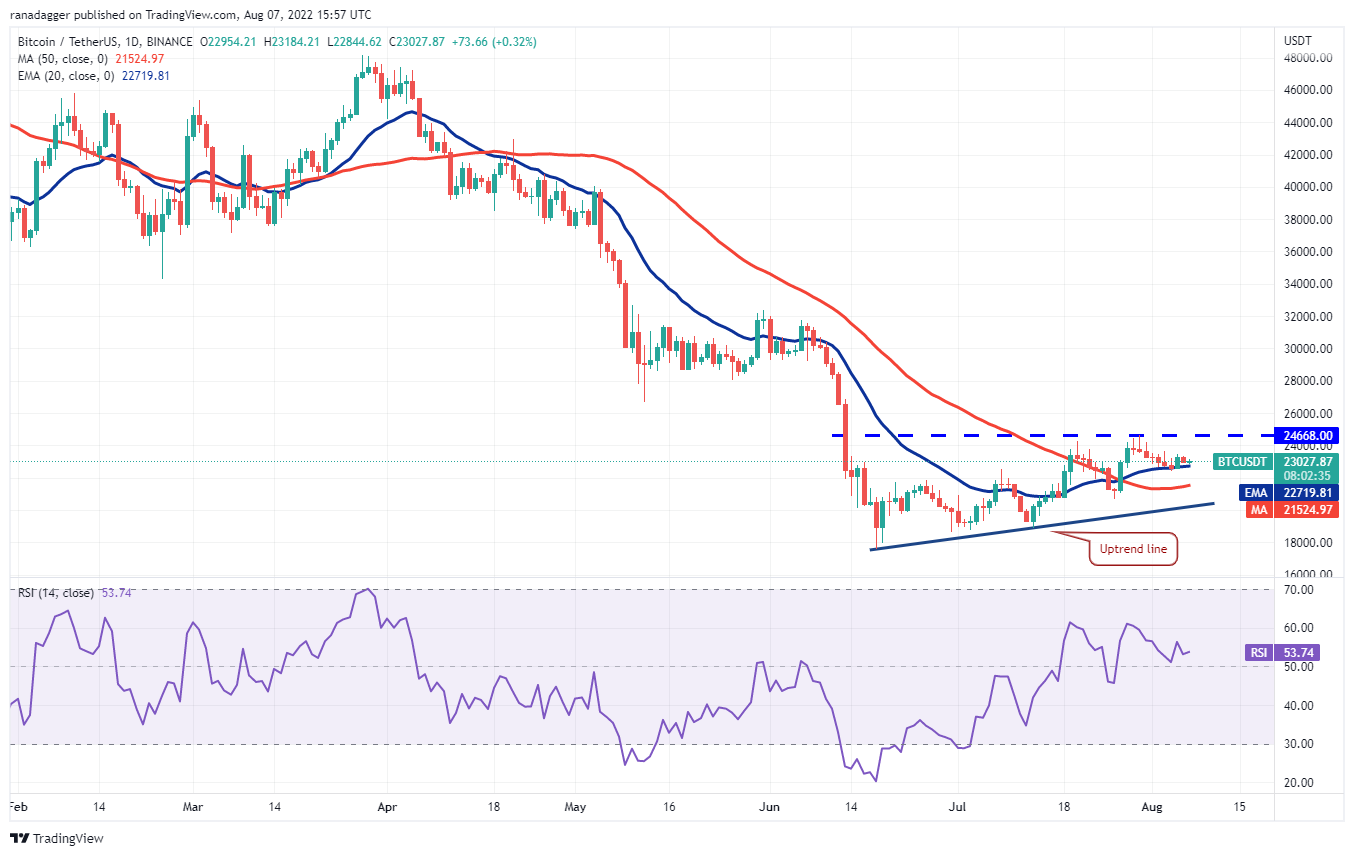
Both moving averages have flattened out and the relative strength index (RSI) is just above the midpoint, indicating a balance between buyers and sellers. The advantage could tilt in favor of the buyers if they push and sustain the price above $24,668.
If they manage to do that, the BTC/USDT pair could rally to $28,000 and then to the next overhead resistance at $32,000.
Contrary to this assumption, if bears pull the price below the 20-day EMA, the pair could decline to the 50-day simple moving average ($21,719). If this support also gives way, the next stop could be the uptrend line.
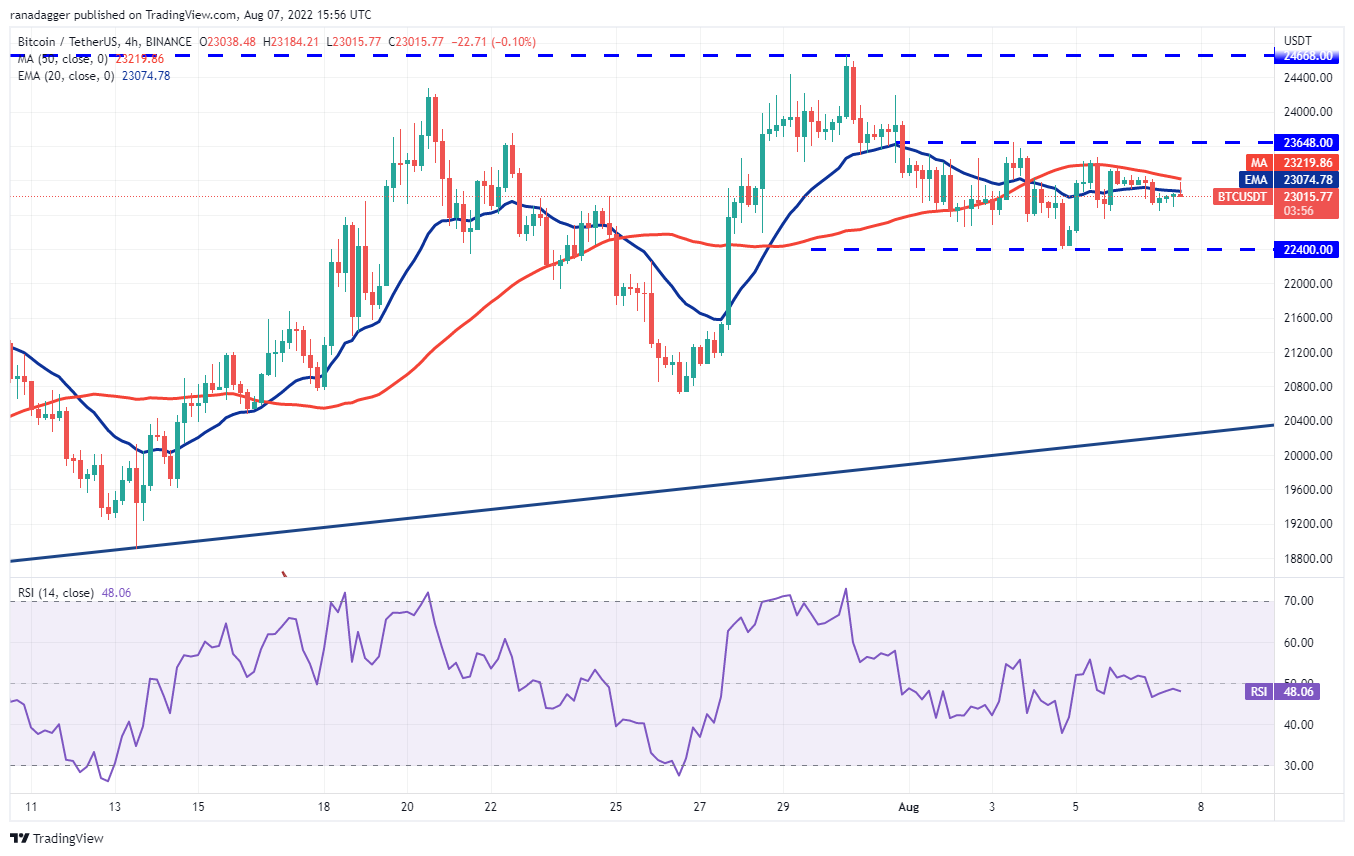
The price is stuck between $22,400 and $23,648 on the 4-hour chart. Both moving averages have flattened out and the RSI is near the midpoint, indicating a balance between supply and demand. If bulls drive the price above $23,648, the pair could rise to the overhead resistance at $24,668.
Conversely, if the price turns down and breaks below $22,400, it will tilt the short-term advantage in favor of the bears. The pair could then decline to the uptrend line, which could act as a strong support.
FLOW/USDT
The tight range trading in Flow (FLOW) resolved to the upside with the range expansion on Aug. 4. This indicates accumulation at lower levels and the start of a new up-move.
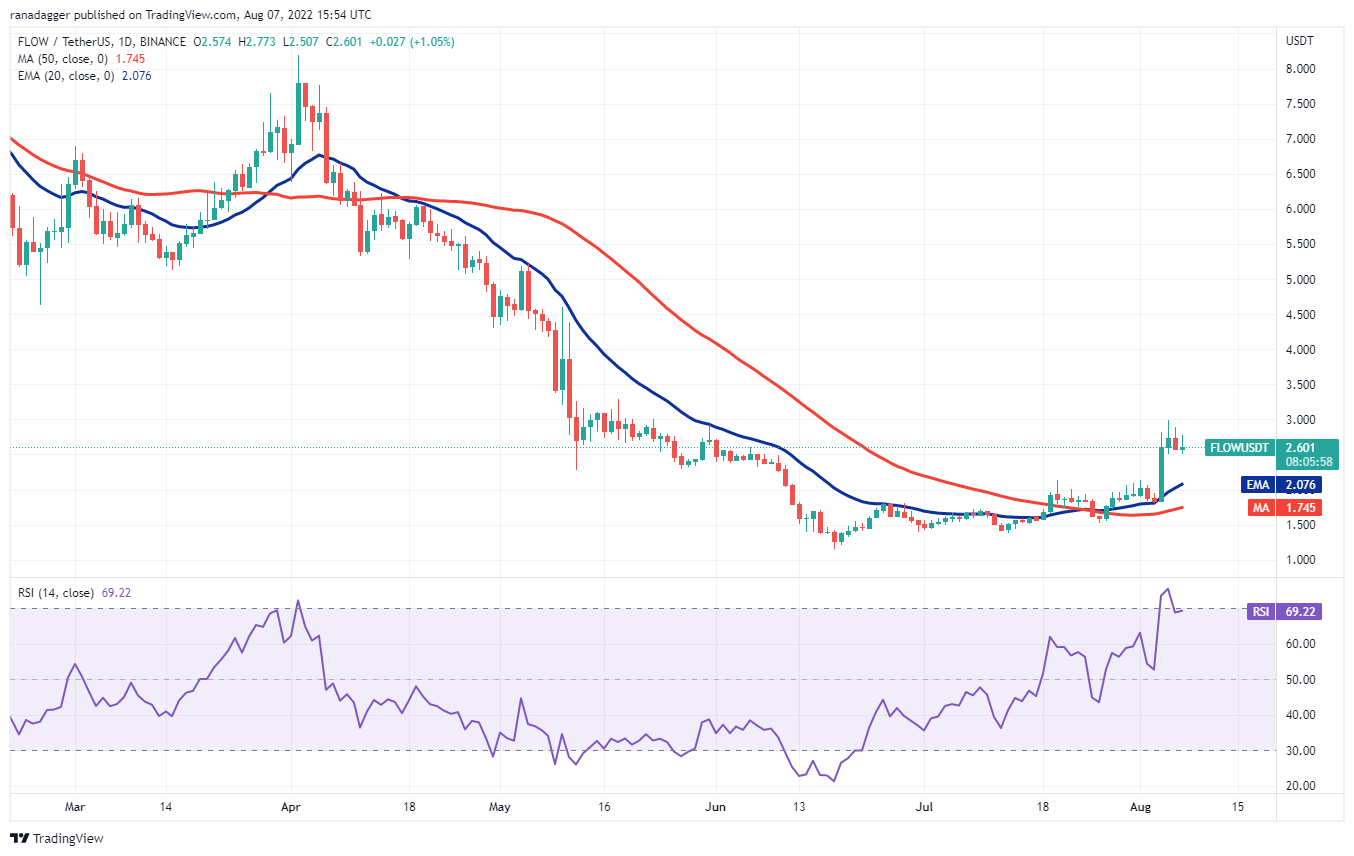
The bears are attempting to stall the up-move near $3 but a minor positive is that the bulls have not given up much ground. This indicates that traders are not hurrying to book profits after the recent rally.
The 20-day EMA ($2.07) has started to turn up and the RSI is near the overbought zone, indicating that bulls have the upper hand. If buyers drive the price above the $3 to $3.30 resistance zone, the FLOW/USDT pair could pick up momentum and rally toward $4.60.
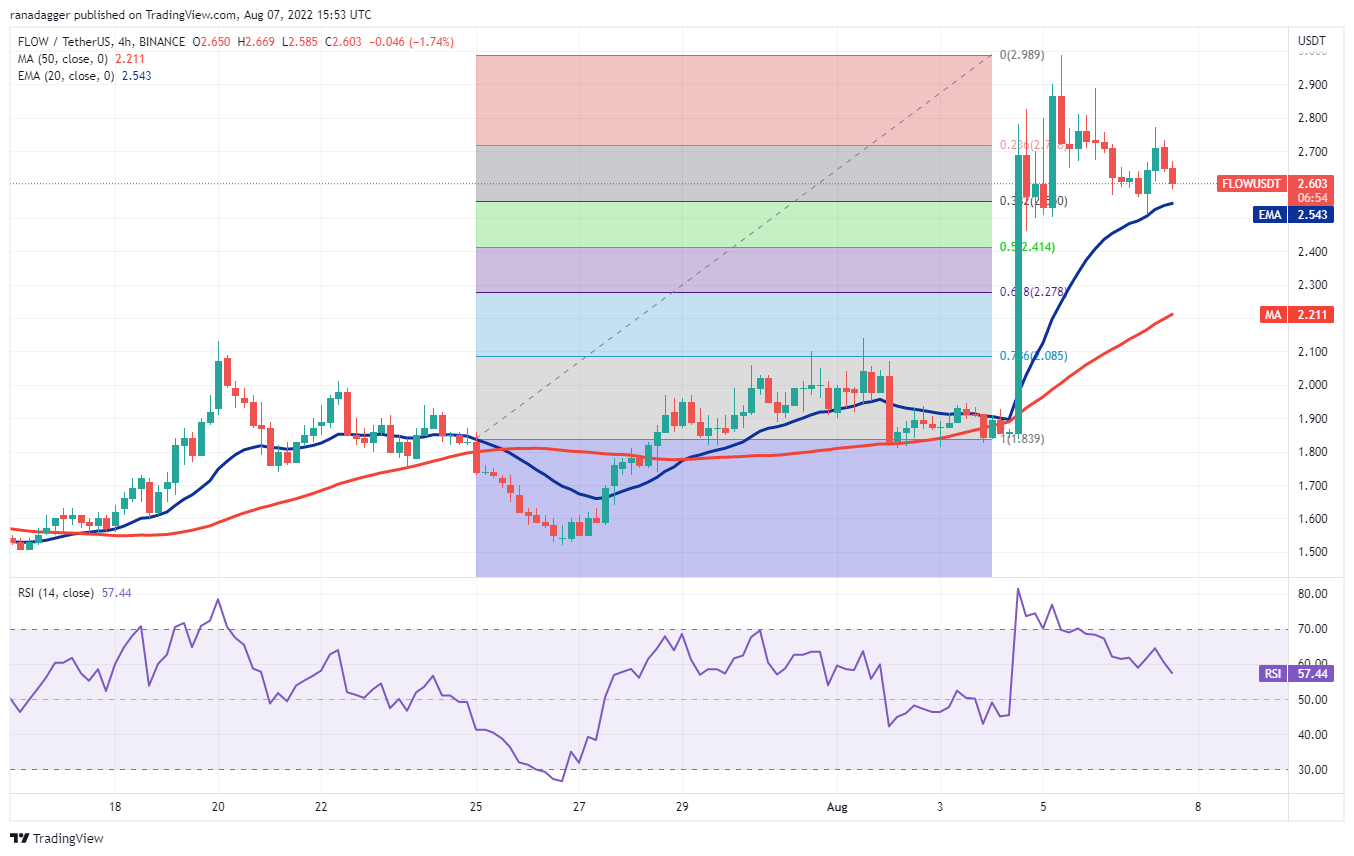
The pair has turned down from the overhead resistance near $3 but is finding support at the 20-EMA on the 4-hour chart. If bulls push the price above $2.80, the pair could retest the overhead resistance at $2.99. A break above this level could signal the resumption of the uptrend.
Alternatively, if the price slips below the 20-EMA, the pair could drop to the 50% Fibonacci retracement level of $2.41, and then to the 61.8% retracement level of $2.27. A break below this level could tilt the advantage in favor of the bears and sink the pair to $2.
THETA/USDT
Theta Network (THETA) broke and closed above the stiff overhead resistance at $1.55 on Aug. 5, indicating that the range had resolved in favor of the bulls. The bears tried to sink the price back below the breakout level on Aug. 6 but the bulls held their ground.
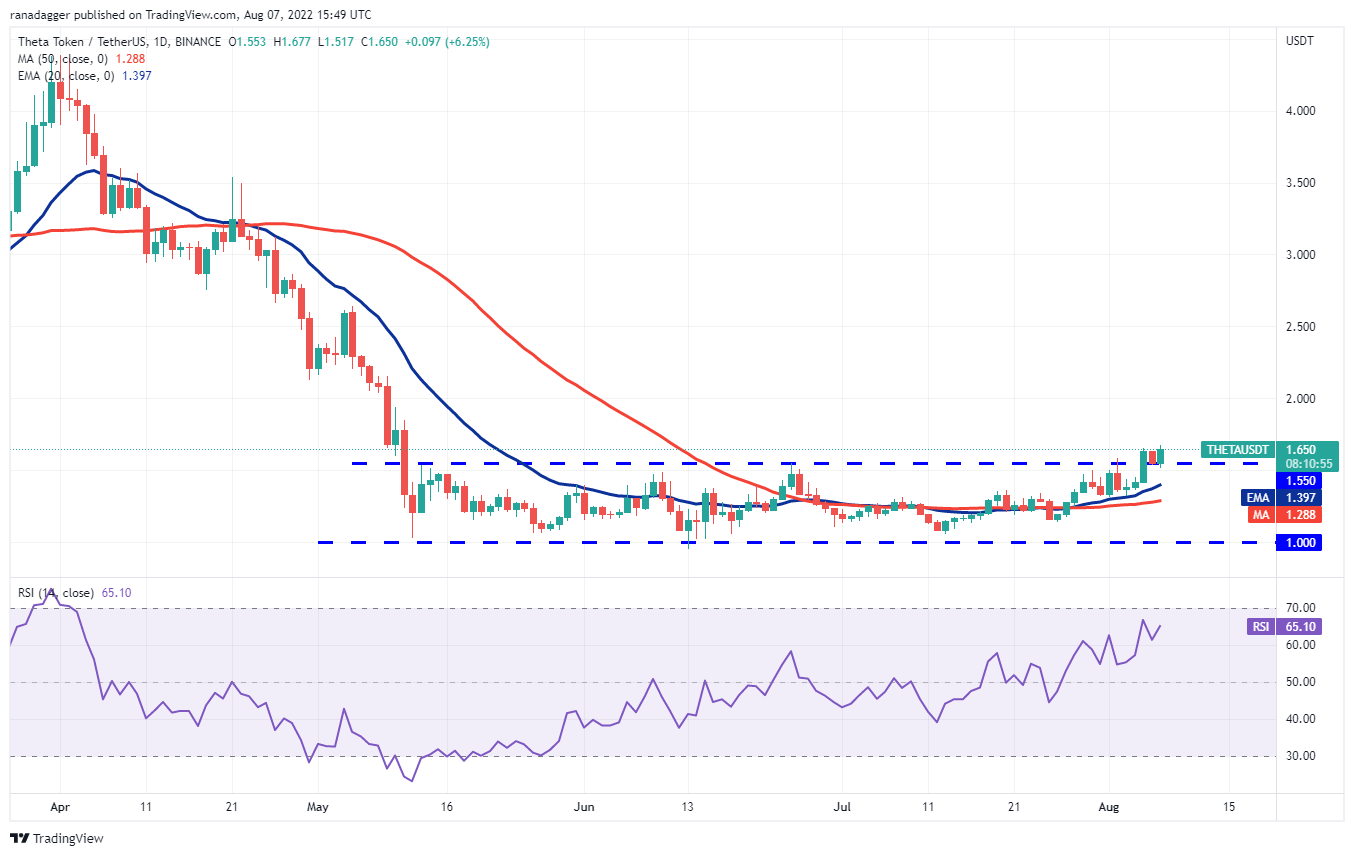
The 20-day EMA ($1.39) has started to turn up and the RSI is in the positive territory, indicating advantage to buyers. If bulls sustain the price above $1.65, the THETA/USDT pair could start a new uptrend toward the pattern target of $2.10. This level may pose a strong challenge but if bulls clear this overhead hurdle, the pair could extend its rally to $2.60.
To invalidate this positive view, the bears will have to pull and sustain the price below $1.55. If that happens, the aggressive bulls may get trapped and the pair could slide to the moving averages.

The 4-hour chart shows that the bulls purchased the dip to the 20-EMA, indicating buying on dips. Both moving averages on the 4-hour chart are sloping up and the RSI is near the overbought territory, indicating that the path of least resistance is to the upside. If bulls maintain the price above $1.65, the up-move may resume.
The first sign of weakness will be a break and close below the 20-EMA. If that happens, the pair could drop to the 50-SMA. The bears will have to sink the price below this level to signal that the uptrend may have ended in the near term.
Related: What is Chainlink VRF and how does it work?
QNT/USDT
Quant (QNT) made a strong recovery from its intraday low of $40 made on June 13. The bears tried to stall the up-move at $115 but the bulls aggressively purchased the dip below the 20-day EMA ($103) on July 26.
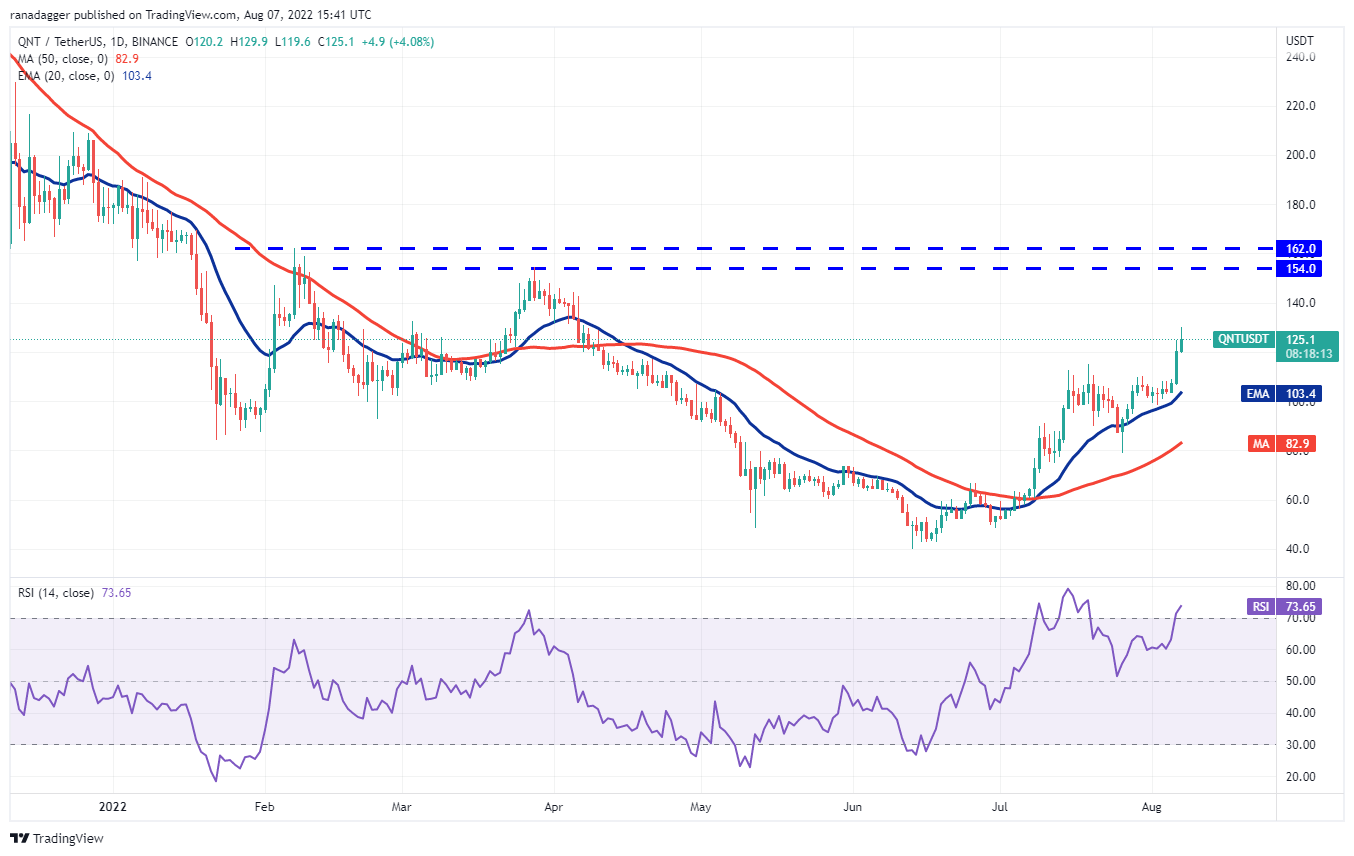
The bulls maintained their momentum and pushed the price above the overhead resistance at $115 on Aug. 6. This indicated the resumption of the uptrend. The QNT/USDT pair could rally to the overhead resistance zone between $154 to $162 where the bears may mount a strong defense.
Alternatively, if the price turns down from the current level, the bulls will attempt to flip the $115 level into support. If that happens, the pair could resume its uptrend. The bears will have to sink and sustain the price below the 20-day EMA to gain the upper hand.
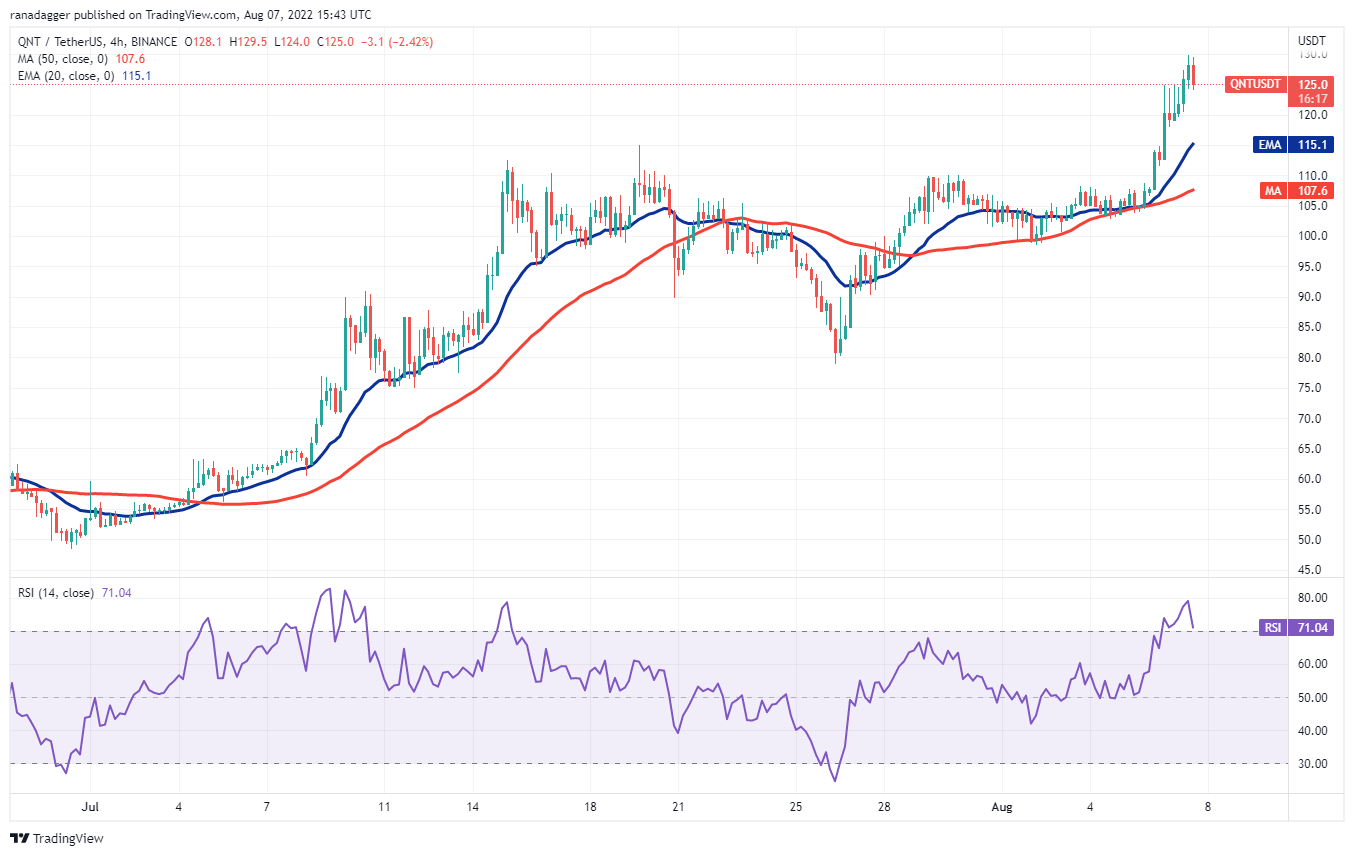
The pair is in an uptrend but the RSI on the 4-hour chart jumped into the overbought territory, indicating the possibility of a near-term correction. The bulls are expected to buy the dips to the 20-EMA. If they do that, it will suggest that the sentiment remains positive and traders are buying on dips. That will increase the likelihood of the resumption of the uptrend.
On the contrary, if the price turns down from the current level and breaks below the 20-EMA, the pair could slide to the 50-SMA. This is an important level to keep an eye on because a break below it could result in a fall to $100.
MKR/USDT
Maker’s (MKR) recovery is facing stiff resistance near $1,100 but a positive sign is that the bulls have not allowed the price to dip below the 20-day EMA ($1,044).

The moving averages are sloping up and the RSI is in the positive territory, indicating that buyers have the upper hand.
If bulls push and sustain the price above the overhead resistance zone between $1,100 and $1,188, the MKR/USDT pair could rally to $1,400 and then to the pattern target of $1,570. Such a move will suggest that the pair may have bottomed out.
Contrary to this assumption, if the price turns down from the overhead resistance and breaks below the 20-day EMA, the pair could slide to the trendline. A break and close below this level will invalidate the bullish setup.
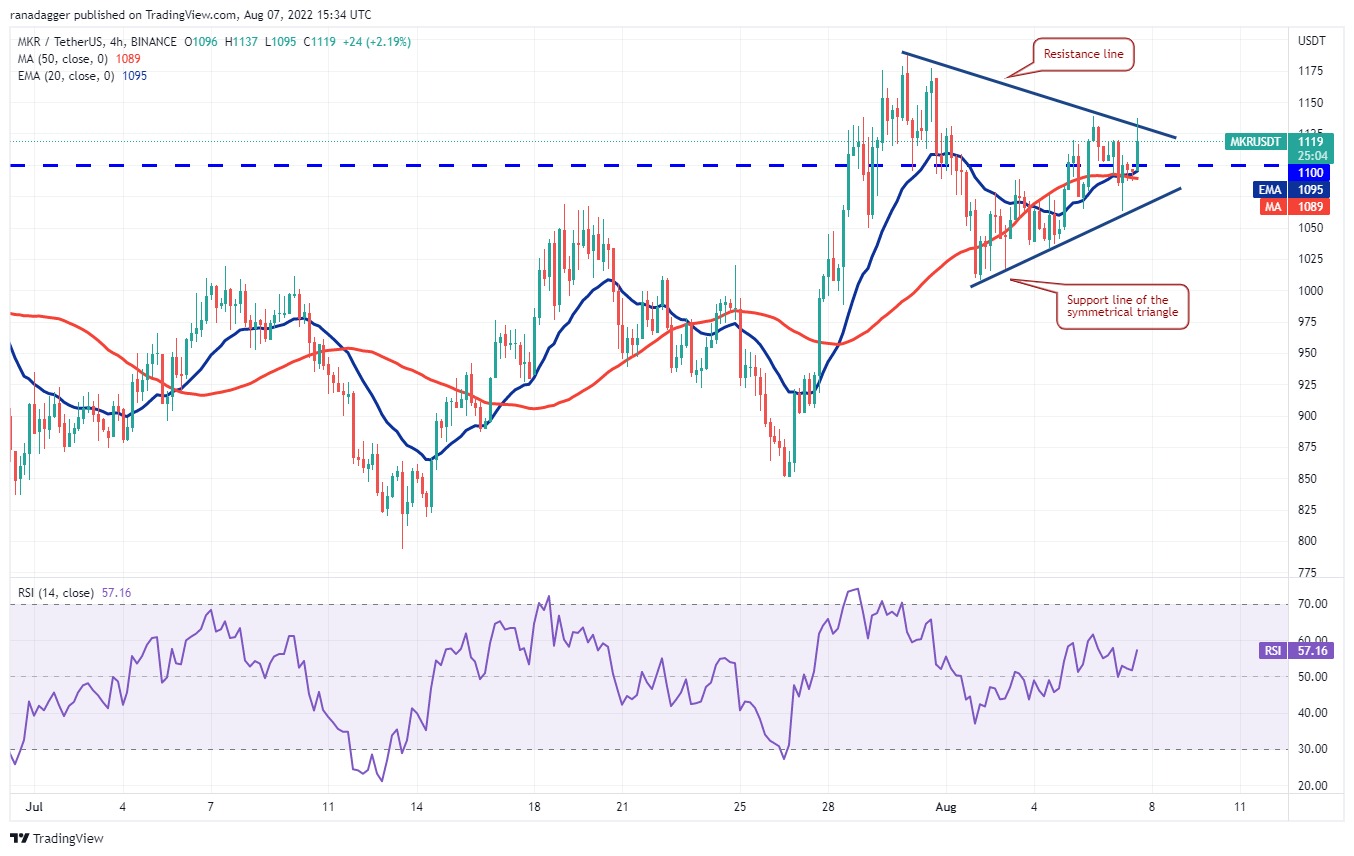
The pair has formed a symmetrical triangle on the 4-hour chart. The 20-EMA is sloping up gradually and the RSI is in the positive zone, indicating a slight advantage to the bulls.
If buyers drive the price above the resistance line, the pair could rally to the overhead resistance at $1,188. A break and close above this level could indicate the resumption of the uptrend.
Conversely, a break below the support line of the triangle could tilt the advantage in favor of the sellers. The pair could then decline to the psychological level at $1,000.
The views and opinions expressed here are solely those of the author and do not necessarily reflect the views of Cryptox.com. Every investment and trading move involves risk, you should conduct your own research when making a decision.


