The price action over the past few days has undoubtedly been positive for Bitcoin. After building momentum for weeks, the cryptocurrency finally burst past $10,000 this week, hitting a $10,100 high.
Since this initial breach, BTC has slowed. The cryptocurrency has traded within a percentage point of $10,000 for the last 12 hours, barely deviating as bulls and bears clash.
Some say this consolidation is indicative of an impending breach to the upside, yet there’s a rapidly growing sell wall above $10,000. This would indicate that Bitcoin moving higher from here will be very difficult.
Related Reading: Bitcoin Whales Have Been Buying En-Masse Since Early-2020: “Macro Bullish” Sign
There’s a Sell Wall Brewing Above Bitcoin
According to Nik Yaremchuk, a former analyst at crypto fund Adaptive Capital, there’s massive selling pressure building above the Bitcoin price.
Pointing to order book data from Bitfinex, he noted that there is approximately 3,000 BTC ($30 million) worth of sell-side positions from the current price of $10,010 until $10,230.
Should BTC fail to catch a bid during any really in the coming hours, it could be strongly rejected by the sell wall. The wall will act as resistance for the cryptocurrency market as long as it is on the order book.
Chart from Nik Yaremchuk
Another trader indicated that on OKEx, there was a similar sell wall of approximately 1,000 BTC until $10,200. This suggests that the abovementioned wall is not a spoof, but rather serious selling pressure from big market players.
This isn’t the only bearish sign.
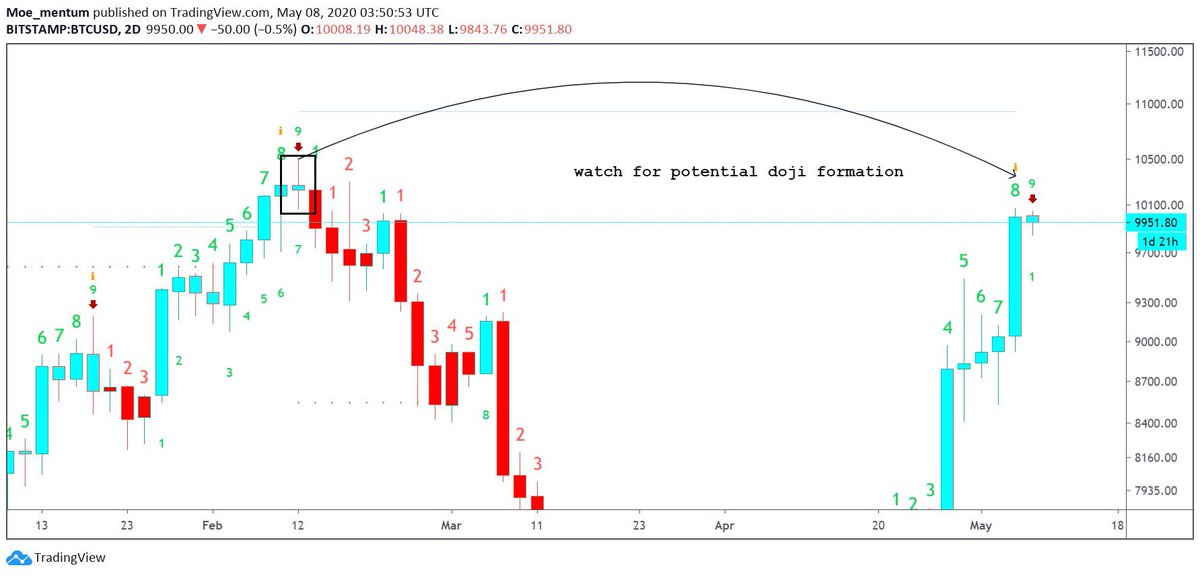
Per previous reports from NewsBTC, a top analyst noted that on Bitcoin’s two-day chart, the Tom Demark Sequential (TD Sequential) printed a “9.” This was last seen at the peak of the Q1 2020 bull run at $10,500. What followed was a steep decline of over 60% towards $3,700.
“9” TD Sequential candles are often seen at reversal points in markets, as evidenced in the chart below.

Chart from @Moe_Mentum_
Can Bulls Break Through?
Although there is this building sell wall, investors are betting on the chances cryptocurrency will eventually break through.
Citing data from Glassnode, Willy Woo on May 5th noted that the population of large Bitcoin holders (1,000+ coins) has increased strongly since January’s lows. This indicates these users have been in “solid accumulation mode,” which is a “macro bullish” trend:
“Whale population spotted increasing in the wild. They’ve been in solid accumulation mode since January unperturbed by the COVID crash. This is macro bullish,” Woo said in reference to the chart below.
Their optimism is seemingly related to Bitcoin’s ongoing surge in fundamental strength.
Just yesterday, Paul Tudor Jones, a billionaire macro investor, revealed that his fund will be buying Bitcoin.
Jones explained that from how he sees it, the top cryptocurrency in the ongoing macroeconomic backdrop is eerily reminiscent of gold in the 1970s. The investor added that while he subjectively sees Bitcoin as the worst store of value amongst fiat, gold, and financial assets, he sees the cryptocurrency as the “fastest horse in the race.”
Photo by Erwan Hesry on Unsplash


