The price of Dogecoin (DOGE) has continued to remain strong against Tether (USDT) despite growing bearish market sentiment as other crypto assets continue to decline in price.
Bitcoin has shown bearish signs after being rejected from $25,200, but the price of DOGE has continued to trend higher with eyes set on the $0.1 mark.
Dogecoin (DOGE) Price Analysis On The Weekly Chart
From the chart, the price of DOGE saw a weekly low of $0.052, which bounced from that area and rallied to a price of $0.088 after showing no side of recovery in recent weeks.
DOGE’s weekly candle closed with a bullish sentiment with the new week’s candle looking more bullish for the price of DOGE as it rallies to as high as $0.088 before facing a minor retracement to the area of $0.0812.
The price has struggled to build more momentum as it faces resistance at $0.88.
If the price of DOGE on the weekly chart continues with this structure, it could quickly revisit $0.11 acting as a resistance for the price of DOGE.
Weekly resistance for the price of BTC – $0.88.
Weekly support for the price of BTC – $0.066.
Price Analysis Of DOGE On The Daily (1D) Chart

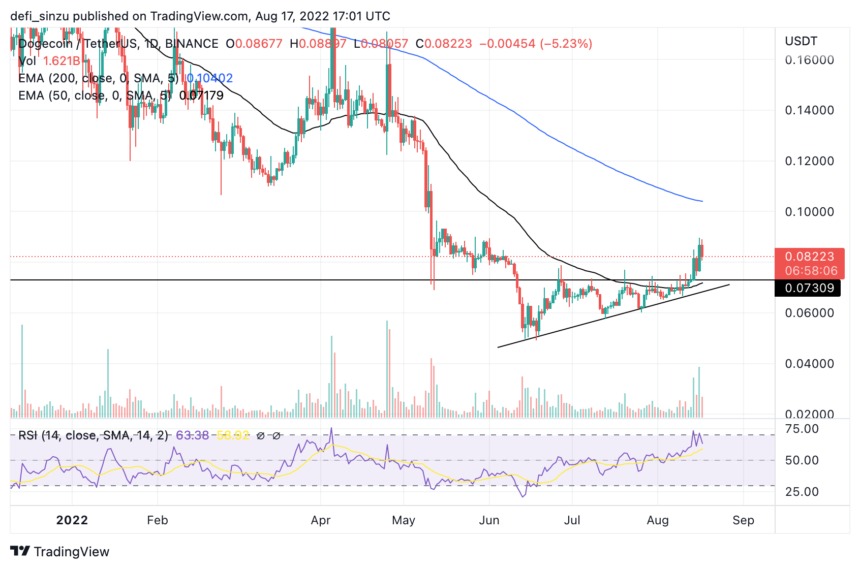
The price of DOGE found strong support at $0.072 above the asymmetric triangle after a successful breakout, with what seems to be an area of interest on the daily chart.
DOGE bounced from its support and rallied to $0.088 where it was faced with resistance and was rejected from that region.
The price of DOGE has continued to range after being rejected from the $0.088 mark, breaking out of this resistance to the upside could mean a retest of the $0.1 area.
At the point of writing, the price of DOGE is at $0.082, above the 50 Exponential Moving Average (EMA) which corresponds to $0.072.
DOGE needs to hold above this support area that corresponds with the 50 EMA, a break below this region could send the price of DOGE to $0.06.
The Relative Strength Index (RSI) for the price of DOGE on the daily chart is above 70, Indicating good buy bids.
Daily (1D) resistance for DOGE price – $0.88.
Daily (1D) support for DOGE price – $0.076, $0.073.
Price Analysis OF DOGE On The Four-Hourly (4H) Chart

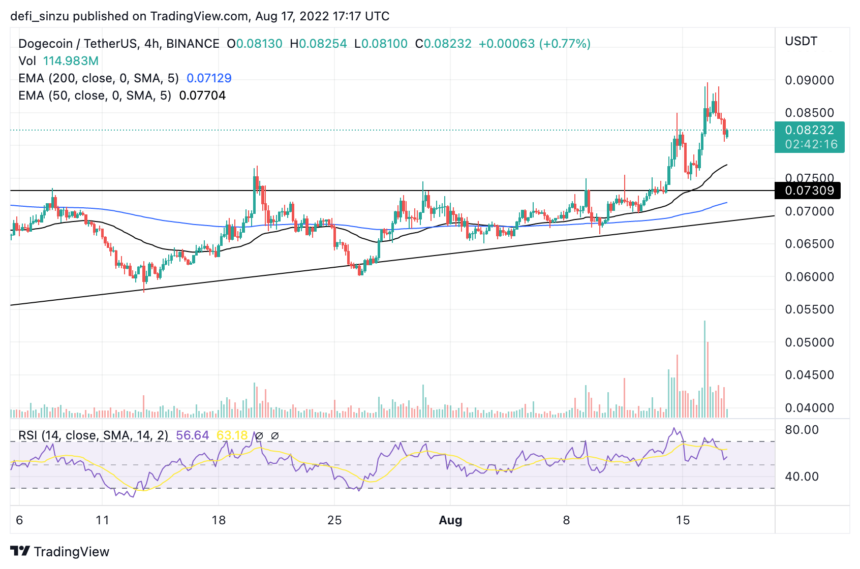
The price of DOGE continues to look bullish and holds above the 50 and 200 EMA prices that correspond to $0.077 and $0.071.
On the 4H timeframe, the 50 and 200 EMA are acting as support for the price of DOGE after breaking out of the wedge and trending higher.
If DOGE fails to hold these support regions we could retest the region of $0.066 as the next support area to hold the DOGE price.
Four-Hourly (4H) resistance for DOGE price – $0.088.
Four-Hourly (4H) support for DOGE price – $0.077, $0.071.
Featured image from zipmex, Charts from TradingView.com


